
AI项目十八:YOLOV8自训练关键点检测
若该文为原创文章,转载请注明原文出处。记录学习YOLOV8过程,自训练关键点检测模型。清华源:-i。
若该文为原创文章,转载请注明原文出处。
记录学习YOLOV8过程,自训练关键点检测模型。
清华源:-i https://mirror.baidu.com/pypi/simple
1、yolov8安装
git clone https://github.com/ultralytics/ultralytics
cd ultralytics
pip install -e .安装成功后,使用命令 yolo 简单看下版本
(yolov8) llh@anhao:/$ yolo version
8.0.2062、简单测试
下载权重文件
GitHub - ultralytics/ultralytics: NEW - YOLOv8 🚀 in PyTorch > ONNX > OpenVINO > CoreML > TFLite
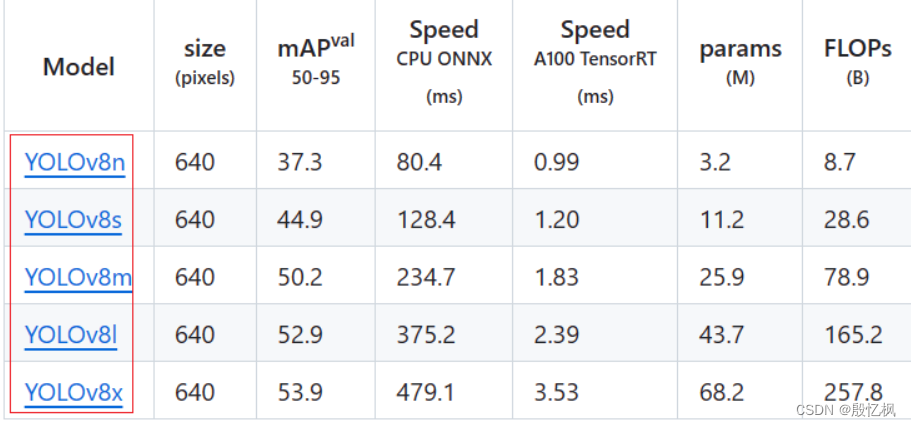
直接点击下载。
获取测试图片的文件在ultralytics\assets目录有,使用的是的里面的bus.jpg测试。
使用 yolo 命令进行测试
yolo detect predict model=./yolov8n.pt source=./bus.jpg
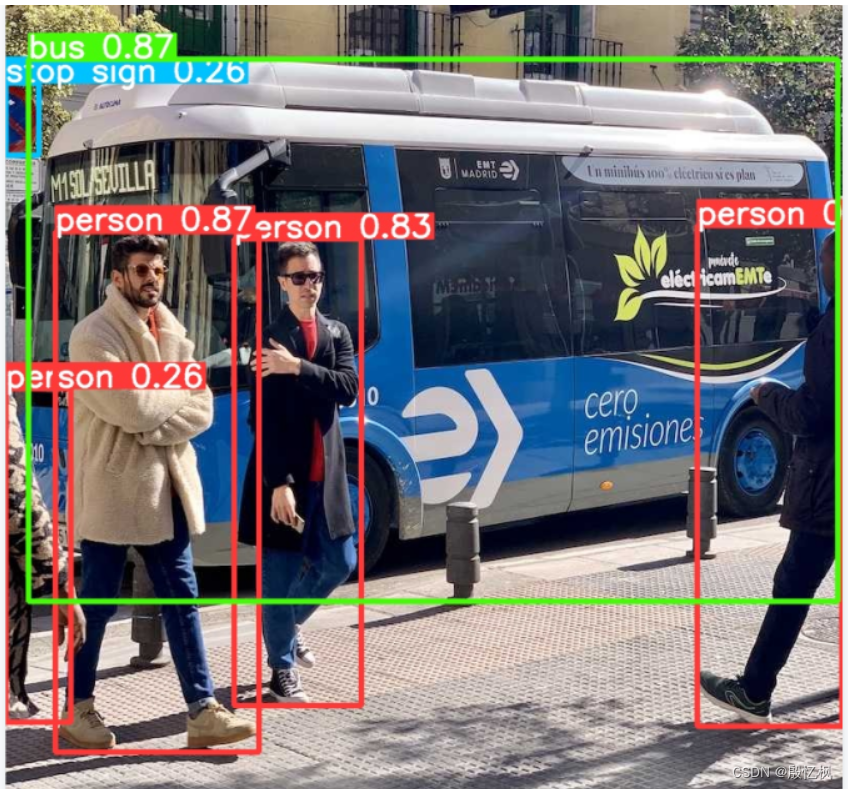
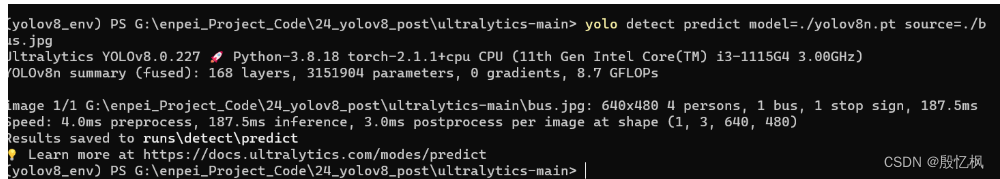 输出在runs/detect/predict/目录下。
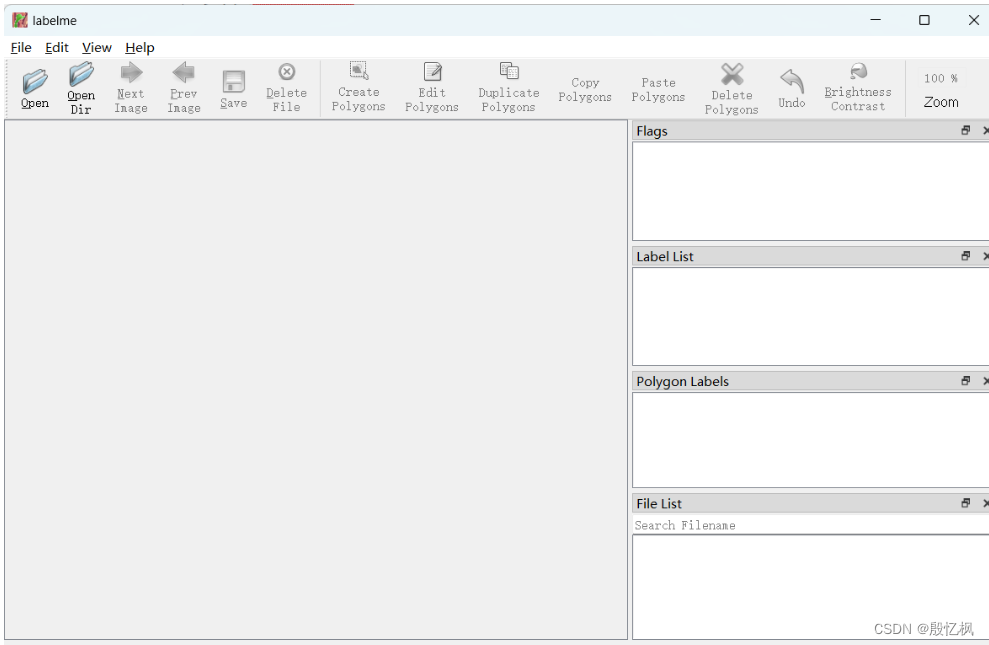
3、安装labelme
pip install labelme直接在终端运行labelme打开软件
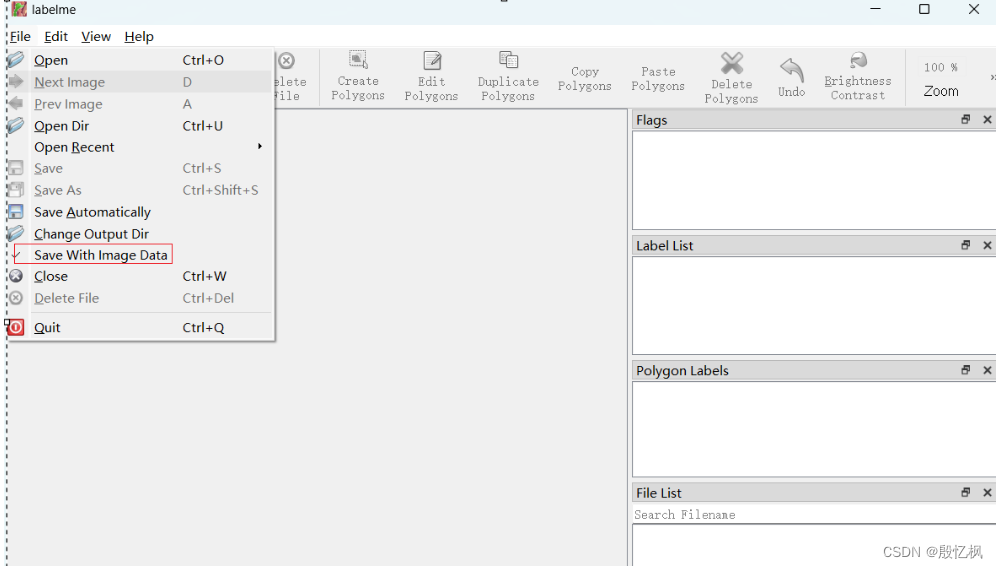
 先取消“保存图片数据”(减少标注文件大小);在文件下
 打开文件目录
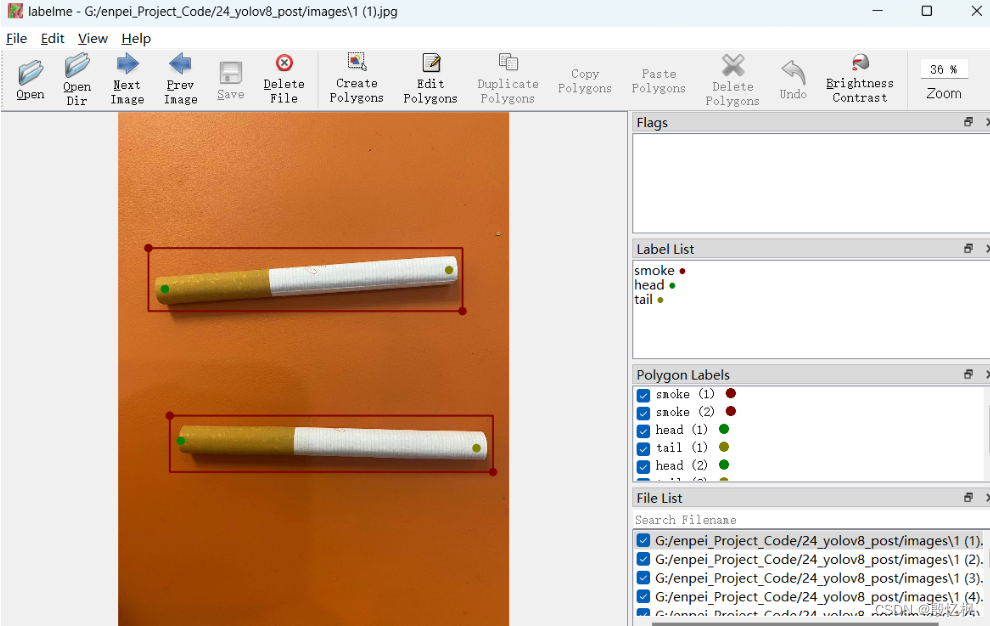 接下来标注
接下来标注
-
先标注检测框,检测框用Create Rectangle(Ctrl+N)
-
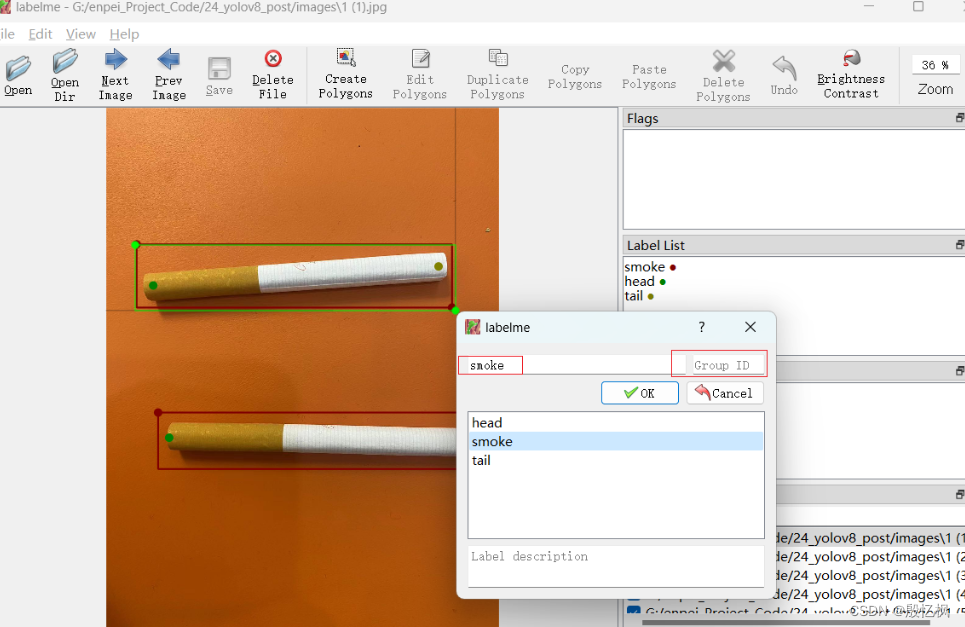
填写类别名称
-
填写
group_id,用于匹配后续标注的关键点,以当前画面中出现的顺序标注即可。
-
-
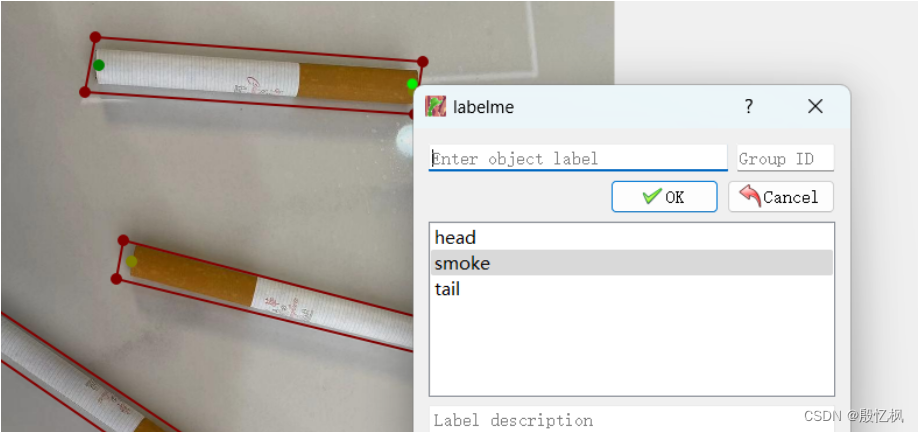
 标注关键点,检测关键点用Create Point
-
按关键点顺序标注,如我们的顺序是
head、tail,不可以错; -
填写关键点名称,如这里是
head; -
填写关键点所在物体的
group_id,匹配检测框
-
 注意,如果多个类型需要填写group_id,group_id要匹配检测框
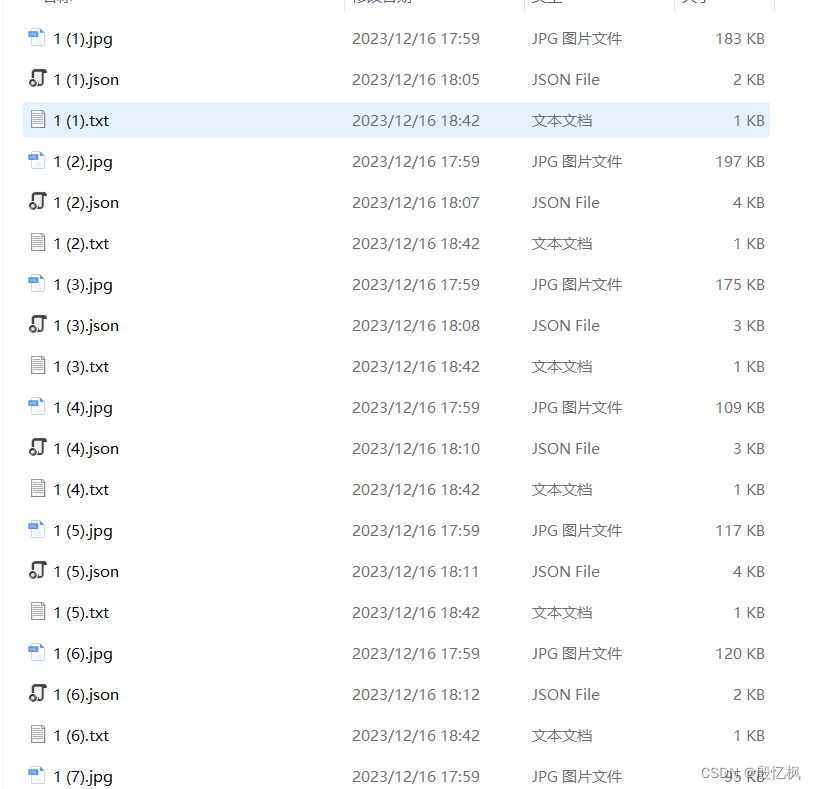
4、把JSON转成TXT
使用labelme标注生成的JSON文件,不能直接训练,所以需要把JSON文件转成TXT文件。
打开一个标注json文件,内容大致如下:
version": "5.3.1",
  "flags": {},
  "shapes": [
    {
      "label": "smoke",
      "points": [
        [
          389.0,
          72.5
        ],
        [
          957.0,
          114.5
        ],
        [
          949.0,
          192.5
        ],
        [
          379.0,
          162.5
        ]
      ],
      "group_id": null,
      "description": "",
      "shape_type": "polygon",
      "flags": {}
    },
但是yolov8 要求的标注文件长这样
0 0.662641 0.494385 0.674719 0.988771 0.717187 0.189583 2.000000 0.798438 0.127083 2.000000 0.701562 0.091667 2.000000 0.921875 0.118750 2.000000 0.000000 0.000000 0.000000 0.971875 0.379167 2.000000 0.554688 0.262500 2.000000 0.000000 0.000000 0.000000 0.367188 0.427083 2.000000 0.767188 0.772917 2.000000 0.421875 0.500000 2.000000 0.829688 0.960417 1.000000 0.517188 0.881250 1.000000 0.000000 0.000000 0.000000 0.000000 0.000000 0.000000 0.000000 0.000000 0.000000 0.000000 0.000000 0.000000根据这些规则,我们可以写一个转换脚本,将labelme标注的json格式转为yolo格式
labelme2yolo.py
# 将labelme标注的json文件转为yolo格式
import os
import cv2
import numpy as np
import matplotlib.pyplot as plt
import glob
import json
import tqdm
# 物体类别
class_list = ["smoke"]
# 关键点的顺序
keypoint_list = ["head", "tail"]
def json_to_yolo(img_data,json_data):
h,w = img_data.shape[:2]
# 步骤:
# 1. 找出所有的矩形,记录下矩形的坐标,以及对应group_id
# 2. 遍历所有的head和tail,记下点的坐标,以及对应group_id,加入到对应的矩形中
# 3. 转为yolo格式
rectangles = {}
# 遍历初始化
for shape in json_data["shapes"]:
label = shape["label"] # pen, head, tail
group_id = shape["group_id"] # 0, 1, 2, ...
points = shape["points"] # x,y coordinates
shape_type = shape["shape_type"]
# 只处理矩形
if shape_type == "rectangle":
if group_id not in rectangles:
rectangles[group_id] = {
"label": label,
"rect": points[0] + points[1], # Rectangle [x1, y1, x2, y2]
"keypoints_list": []
}
# 遍历更新,将点加入对应group_id的矩形中
for keypoint in keypoint_list:
for shape in json_data["shapes"]:
label = shape["label"]
group_id = shape["group_id"]
points = shape["points"]
# 如果匹配到了对应的keypoint
if label == keypoint:
rectangles[group_id]["keypoints_list"].append(points[0])
# 转为yolo格式
yolo_list = []
for id, rectangle in rectangles.items():
result_list = []
label_id = class_list.index(rectangle["label"])
# x1,y1,x2,y2
x1,y1,x2,y2 = rectangle["rect"]
# center_x, center_y, width, height
center_x = (x1+x2)/2
center_y = (y1+y2)/2
width = abs(x1-x2)
height = abs(y1-y2)
# normalize
center_x /= w
center_y /= h
width /= w
height /= h
# 保留6位小数
center_x = round(center_x, 6)
center_y = round(center_y, 6)
width = round(width, 6)
height = round(height, 6)
# 添加 label_id, center_x, center_y, width, height
result_list = [label_id, center_x, center_y, width, height]
# 添加 p1_x, p1_y, p1_v, p2_x, p2_y, p2_v
for point in rectangle["keypoints_list"]:
x,y = point
x,y = int(x), int(y)
# normalize
x /= w
y /= h
# 保留6位小数
x = round(x, 6)
y = round(y, 6)
result_list.extend([x,y,2])
yolo_list.append(result_list)
return yolo_list
# 获取所有的图片
img_list = glob.glob("./*.jpg")
for img_path in tqdm.tqdm( img_list ):
img = cv2.imread(img_path)
print(img_path)
json_file = img_path.replace('jpg', 'json')
with open(json_file) as json_file:
json_data = json.load(json_file)
yolo_list = json_to_yolo(img, json_data)
yolo_txt_path = img_path.replace('jpg', 'txt')
with open(yolo_txt_path, "w") as f:
for yolo in yolo_list:
for i in range(len(yolo)):
if i == 0:
f.write(str(yolo[i]))
else:
f.write(" " + str(yolo[i]))
f.write("\n")
运行后,把JSON生成TXT。
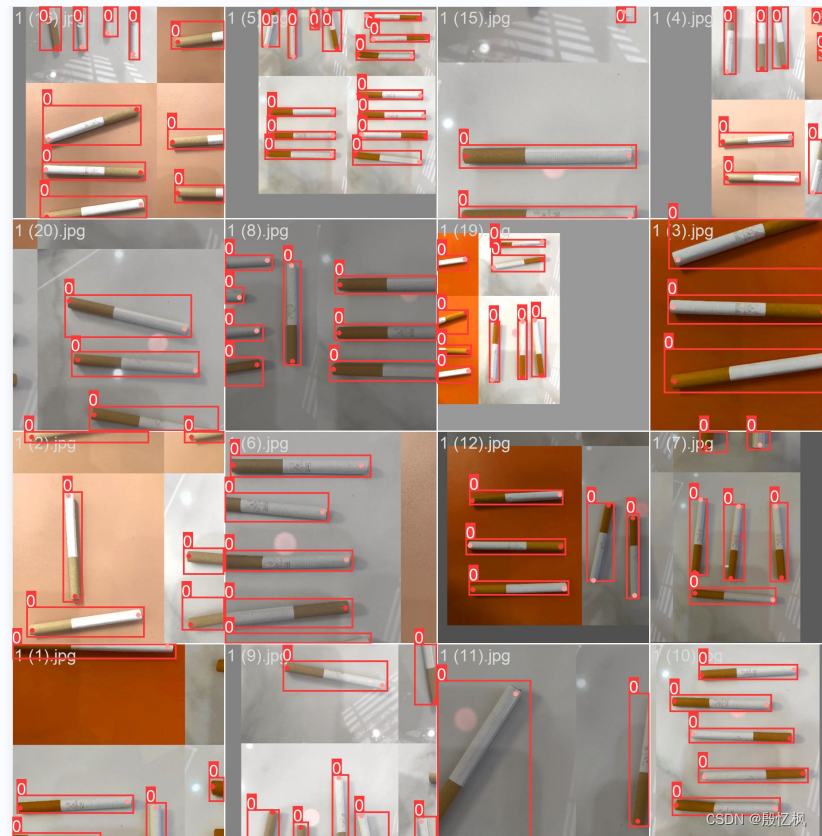
5、对yolo格式的标注进行可视化。检查标注是否正确。
先安装jupyter
pip install jupyter然后在终端输入
jupyter-labimport os
import cv2
import numpy as np
import matplotlib.pyplot as plt
import glob
img_path = './images/1.original_annotated/1 (20).jpg'
plt.figure(figsize=(15,10))
img = cv2.imread(img_path)
plt.imshow(img[:,:,::-1])
plt.axis('off')
yolo_txt_path = img_path.replace('jpg', 'txt')
print(yolo_txt_path)
with open(yolo_txt_path, 'r') as f:
lines = f.readlines()
lines = [x.strip() for x in lines]
label = np.array([x.split() for x in lines], dtype=np.float32)
# 物体类别
class_list = ["smoke"]
# 类别的颜色
class_color = [(255, 0, 0), (0, 255, 0), (0, 0, 255), (255,255,0)]
# 关键点的顺序
keypoint_list = ["head", "tail"]
# 关键点的颜色
keypoint_color = [(255, 0, 0), (0, 255, 0)]
# 绘制检测框
img_copy = img.copy()
h,w = img_copy.shape[:2]
for id,l in enumerate( label ):
# label_id ,center x,y and width, height
label_id, cx, cy, bw, bh = l[0:5]
label_text = class_list[int(label_id)]
# rescale to image size
cx *= w
cy *= h
bw *= w
bh *= h
# draw the bounding box
xmin = int(cx - bw/2)
ymin = int(cy - bh/2)
xmax = int(cx + bw/2)
ymax = int(cy + bh/2)
cv2.rectangle(img_copy, (xmin, ymin), (xmax, ymax), class_color[int(label_id)], 2)
cv2.putText(img_copy, label_text, (xmin, ymin-10), cv2.FONT_HERSHEY_SIMPLEX, 1, class_color[int(label_id)], 2)
# display the image
plt.figure(figsize=(15,10))
plt.imshow(img_copy[:,:,::-1])
plt.axis('off')
# save the image
cv2.imwrite("./tmp.jpg", img_copy)
img_copy = img.copy()
h,w = img_copy.shape[:2]
for id,l in enumerate( label ):
# label_id ,center x,y and width, height
label_id, cx, cy, bw, bh = l[0:5]
label_text = class_list[int(label_id)]
# rescale to image size
cx *= w
cy *= h
bw *= w
bh *= h
# draw the bounding box
xmin = int(cx - bw/2)
ymin = int(cy - bh/2)
xmax = int(cx + bw/2)
ymax = int(cy + bh/2)
cv2.rectangle(img_copy, (xmin, ymin), (xmax, ymax), class_color[int(label_id)], 2)
cv2.putText(img_copy, label_text, (xmin, ymin-10), cv2.FONT_HERSHEY_SIMPLEX, 2, class_color[int(label_id)], 2)
# draw 17 keypoints, px,py,pv,px,py,pv...
for i in range(5, len(l), 3):
px, py, pv = l[i:i+3]
# rescale to image size
px *= w
py *= h
# puttext the index
index = int((i-5)/3)
# draw the keypoints
cv2.circle(img_copy, (int(px), int(py)), 10, keypoint_color[int(index)], -1)
keypoint_text = "{}_{}".format(index, keypoint_list[index])
cv2.putText(img_copy, keypoint_text, (int(px), int(py)-10), cv2.FONT_HERSHEY_SIMPLEX, 1, keypoint_color[int(index)], 2)
plt.figure(figsize=(15,10))
plt.imshow(img_copy[:,:,::-1])
plt.axis('off')
# save
cv2.imwrite('./tmp.jpg', img_copy)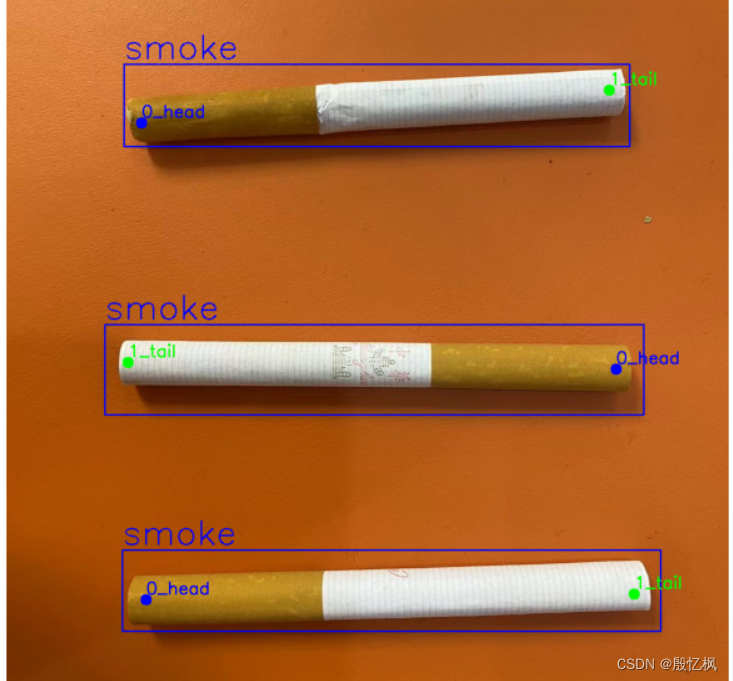
6、训练
组织目录结构,我是直接把datasets目录放到yolov8的根目录下:
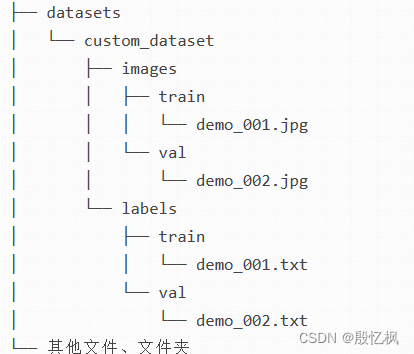
- 图片
datasets/custom_dataset/images/train/{文件名}.jpg对应的标注文件在datasets/custom_dataset/labels/train/{文件名}.txt,YOLO会根据这个映射关系自动寻找(images换成labels); - 训练集和验证集
images文件夹下有train和val文件夹,分别放置训练集和验证集图片;labels文件夹有train和val文件夹,分别放置训练集和验证集标签(yolo格式)。
配置文件smoke.yaml
# Ultralytics YOLO 🚀, AGPL-3.0 license
# COCO8-pose dataset (first 8 images from COCO train2017) by Ultralytics
# Example usage: yolo train data=coco8-pose.yaml
# parent
# ├── ultralytics
# └── datasets
#     └── coco8-pose  ← downloads here (1 MB)


# Train/val/test sets as 1) dir: path/to/imgs, 2) file: path/to/imgs.txt, or 3) list: [path/to/imgs1, path/to/imgs2, ..]
path: ../datasets/custom_dataset  # dataset root dir
train: images/train  # train images (relative to 'path') 4 images
val: images/val  # val images (relative to 'path') 4 images
test:  # test images (optional)

# Keypoints
kpt_shape: [2, 3]  # number of keypoints, number of dims (2 for x,y or 3 for x,y,visible)
#flip_idx: [0, 2, 1, 4, 3, 6, 5, 8, 7, 10, 9, 12, 11, 14, 13, 16, 15]

# Classes
names:
  0: smoke

# Download script/URL (optional)
#download: https://ultralytics.com/assets/coco8-pose.zip
編寫訓練train.py,訓練自己的模型
from ultralytics import YOLO

# 加载模型
# model = YOLO('yolov8s-pose.yaml')  # 从头训练
model = YOLO('./yolov8s-pose.pt')  # 使用预训练模型 (recommended for training)
# model = YOLO('yolov8s-pose.yaml').load('yolov8s-pose.pt')  # 从yaml构建网络并从预训练模型中迁移权重

# 训练
results = model.train(data='./smoke_pose.yaml', epochs=300, imgsz=640, workers=0, batch=20, project="pen_bolt", name="s120")
执行python train.py
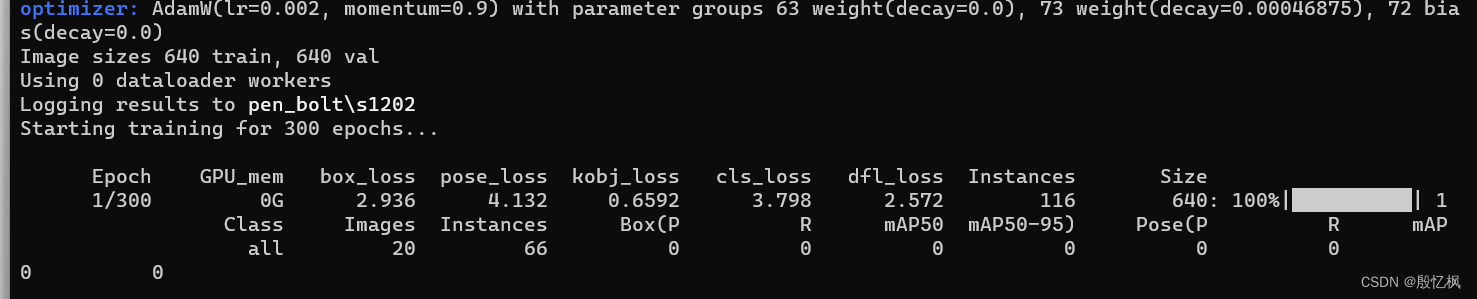
会看到开始训练,并在pen_bolt\s1202下看到训练的结果。
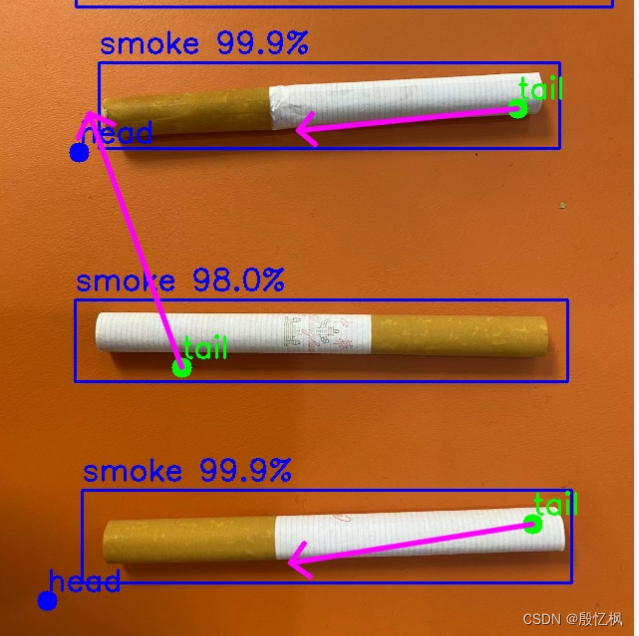
7、测试
由于数据集才20张且只训练了120轮,效果不是太好,所以这里就直接使用图片测试
# 测试图片
from ultralytics import YOLO
import cv2
import numpy as np
import sys
# 读取命令行参数
weight_path = "./pen_bolt/s1202/weights/best.pt"
media_path = "./test.jpg"

# 加载模型
model = YOLO(weight_path )

# 获取类别
objs_labels = model.names  # get class labels
print(objs_labels)


# 类别的颜色
class_color = [(255, 0, 0), (0, 255, 0), (0, 0, 255), (255,255,0)]
# 关键点的顺序
keypoint_list = ["head", "tail"]
# 关键点的颜色
keypoint_color = [(255, 0, 0), (0, 255, 0)]

# 读取图片
frame = cv2.imread(media_path)
frame = cv2.resize(frame, (frame.shape[1]//2, frame.shape[0]//2))
# rotate
# 检测
result = list(model(frame, conf=0.3, stream=True))[0]  # inference,如果stream=False,返回的是一个列表,如果stream=True,返回的是一个生成器
boxes = result.boxes  # Boxes object for bbox outputs
boxes = boxes.cpu().numpy()  # convert to numpy array

# 遍历每个框
for box in boxes.data:
    l,t,r,b = box[:4].astype(np.int32) # left, top, right, bottom
    conf, id = box[4:] # confidence, class
    id = int(id)
    # 绘制框
    cv2.rectangle(frame, (l,t), (r,b), class_color[id], 2)
    # 绘制类别+置信度(格式:98.1%)
    cv2.putText(frame, f"{objs_labels[id]} {conf*100:.1f}%", (l, t-10), cv2.FONT_HERSHEY_SIMPLEX, 1, class_color[id], 2)

# 遍历keypoints
keypoints = result.keypoints  # Keypoints object for pose outputs
keypoints = keypoints.cpu().numpy()  # convert to numpy array

# draw keypoints, set first keypoint is red, second is blue
for keypoint in keypoints.data:
    for i in range(len(keypoint)):
        x,y,c = keypoint[i]
        x,y = int(x), int(y)
        cv2.circle(frame, (x,y), 10, keypoint_color[i], -1)
        cv2.putText(frame, f"{keypoint_list[i]}", (x, y-10), cv2.FONT_HERSHEY_SIMPLEX, 1, keypoint_color[i], 2)

    if len(keypoint) >= 2:
        # draw arrow line from tail to half between head and tail
        x1,y1,c1 = keypoint[0]
        x2,y2,c2 = keypoint[1]
        center_x, center_y = (x1+x2)/2, (y1+y2)/2
        cv2.arrowedLine(frame, (int(x2),int(y2)), (int(center_x), int(center_y)), (255,0,255), 4, line_type=cv2.LINE_AA, tipLength=0.1)


# save image
cv2.imwrite("result.jpg", frame)
print("save result.jpg")
直接python test.py测试,测试同一方向还好,旋转方向后有点不对,怀疑是数据集和参数问题,但整个过程是OK的。
如有侵权,或需要完整代码,请及时联系博主。

开放原子开发者工作坊旨在鼓励更多人参与开源活动,与志同道合的开发者们相互交流开发经验、分享开发心得、获取前沿技术趋势。工作坊有多种形式的开发者活动,如meetup、训练营等,主打技术交流,干货满满,真诚地邀请各位开发者共同参与!
更多推荐

 15
15 1
1- 0


 已为社区贡献3条内容

所有评论(0)