[深度学习] 计算机视觉低代码工具Supervision库使用指北
Supervision库是一款出色的Python计算机视觉低代码工具,其设计初衷在于为用户提供一个便捷且高效的接口,用以处理数据集以及直观地展示检测结果。。Supervision库需要在Python3.8及以上版本的环境下运行。
Supervision库是一款出色的Python计算机视觉低代码工具,其设计初衷在于为用户提供一个便捷且高效的接口,用以处理数据集以及直观地展示检测结果。Supervision库的官方开源仓库地址为:supervision,官方文档地址为:supervision-doc。
Supervision库需要在Python3.8及以上版本的环境下运行。如果需要支持包含OpenCV的GUI组件以支持显示图像和视频,supervision安装方式如下:
pip install supervision[desktop]
如果仅仅想部署应用,而不需要GUI界面,supervision安装方式如下:
pip install supervision
注意,由于supervision版本经常变动,所提供的接口函数会相应发生变化。
import supervision as sv
# 打印supervision的版本
sv.__version__
'0.19.0'
文章目录
1 不同任务的处理
1.1 目标检测与语义分割
1.1.1 结果分析
supervision提供了多种接口来支持对目标检测或语义分割结果的分析。supervision.Detections为主流目标检测或语义分割模型的输出结果分析提供了多种接口,常用的几个接口如下:
- from_ultralytics(Ultralytics, YOLOv8)
- from_detectron2(Detectron2)
- from_mmdetection(MMDetection)
- from_yolov5(YOLOv5)
- from_sam(Segment Anything Model)
- from_transformers(HuggingFace Transformers)
- from_paddledet(PaddleDetecticon)
以上接口的具体使用见:supervision-doc-detection。下面以YOLOv8的结果分析为例,来说明相关代码的使用,以下代码输入图片如下:

import cv2
import supervision as sv
from ultralytics import YOLO

model = YOLO("yolov8n.pt")
# model = YOLO("yolov8n-seg.pt")
image = cv2.imread("img/dog.png")
results = model(image, verbose=False)[0]
# 从YOLOv8中加载数据结果
detections = sv.Detections.from_ultralytics(results)
# 查看输出结果
detections
Detections(xyxy=array([[     255.78,      432.86,      612.01,      1078.5],
       [     255.98,      263.57,      1131.1,       837.2],
       [     927.72,      143.31,      1375.6,      338.81],
       [     926.96,      142.04,      1376.7,      339.12]], dtype=float32), mask=None, confidence=array([    0.91621,     0.85567,     0.56325,     0.52481], dtype=float32), class_id=array([16,  1,  2,  7]), tracker_id=None, data={'class_name': array(['dog', 'bicycle', 'car', 'truck'], dtype='<U7')})
# 查看输出结果预测框个数
len(detections)
4
# 查看第一个框输出结果
detections[0]
Detections(xyxy=array([[ 255.78, 432.86, 612.01, 1078.5]], dtype=float32), mask=None, confidence=array([ 0.91621], dtype=float32), class_id=array([16]), tracker_id=None, data={'class_name': array(['dog'], dtype='<U7')})
# 查看每一个目标边界框的面积
detections.box_area
array([ 2.3001e+05, 5.0201e+05, 87569, 88643], dtype=float32)
# 可视化识别结果

# 确定可视化参数
bounding_box_annotator = sv.BoundingBoxAnnotator()
label_annotator = sv.LabelAnnotator()

labels = [
    model.model.names[class_id]
    for class_id
    in detections.class_id
]

annotated_image = bounding_box_annotator.annotate(
    scene=image, detections=detections)
annotated_image = label_annotator.annotate(
    scene=annotated_image, detections=detections, labels=labels)
sv.plot_image(annotated_image)

在上图标注了三个检测框,然而实际的检测结果中却包含了四个框。这是由于图中的汽车同时被识别为卡车(truck)和轿车(car)。
len(detections)
detections
Detections(xyxy=array([[     255.78,      432.86,      612.01,      1078.5],
       [     255.98,      263.57,      1131.1,       837.2],
       [     927.72,      143.31,      1375.6,      338.81],
       [     926.96,      142.04,      1376.7,      339.12]], dtype=float32), mask=None, confidence=array([    0.91621,     0.85567,     0.56325,     0.52481], dtype=float32), class_id=array([16,  1,  2,  7]), tracker_id=None, data={'class_name': array(['dog', 'bicycle', 'car', 'truck'], dtype='<U7')})
labels
['dog', 'bicycle', 'car', 'truck']
解决的办法是,对目标检测结果执行执行类无关的非最大抑制NMS,代码如下:
detections = detections.with_nms(threshold=0.5, class_agnostic=True)
# 打印输出结果
for class_id in detections.class_id:
    print(model.model.names[class_id])
dog
bicycle
car
1.1.2 辅助函数
计算Intersection over Union(IOU)
import supervision as sv
import numpy as np
box1 = np.array([[50, 50, 150, 150]])  # (x_min, y_min, x_max, y_max)
box2 = np.array([[100, 100, 200, 200]])

print(sv.box_iou_batch(box1,box2))
[[ 0.14286]]
计算Non-Maximum Suppression (NMS)
import supervision as sv
box = np.array([[50, 50, 150, 150, 0.2],[100, 100, 200, 200, 0.5]])  # (x_min, y_min, x_max, y_max, score)

# 返回哪些边界框需要保存
# 参数:输入框数组和阈值
print(sv.box_non_max_suppression(box,0.1))
[False True]
从多边形生成mask
import cv2
import supervision as sv
import numpy as np

# 多边形
vertices = np.array([(50, 50), (30, 50), (60,20), (70, 50), (90, 10)])

# 创建遮罩mask
# 参数:输入框数组和输出mask的宽高
mask = sv.polygon_to_mask(vertices, (100,60))
# mask中白色(像素值为1)表示多边形,其他区域像素值为0
sv.plot_image(mask)

# 从mask生成多边形
# vertices = sv.mask_to_polygons(mask)

根据面积过滤多边形
import supervision as sv
import numpy as np

# 创建包含多个多边形的示例列表
polygon1 = np.array([[0, 0], [0, 1], [1, 1], [1, 0]])
polygon2 = np.array([[0, 0], [0, 2], [2, 2], [2, 0]])
polygon3 = np.array([[0, 0], [0, 3], [3, 3], [3, 0]])

polygons = [polygon1, polygon2, polygon3]

# 参数:输入多边形列表,面积最小值,面积最大值(为None表示无最大值限制)
filtered_polygons = sv.filter_polygons_by_area(polygons, 2.5, None)

print("原始多边形数组个数:", len(polygons))
print("筛选后的多边形数组:", len(filtered_polygons))
原始多边形数组个数: 3
筛选后的多边形数组: 2
缩放边界框
import numpy as np
import supervision as sv

boxes = np.array([[10, 10, 20, 20], [30, 30, 40, 40]])
# 表示按比例缩放长方体尺寸的因子。大于1的因子将放大长方体,而小于1的因子将缩小长方体
factor = 1.2
scaled_bb = sv.scale_boxes(boxes, factor)
print(scaled_bb)
[[          9           9          21          21]
 [         29          29          41          41]]
1.2 目标跟踪
supervision中内置了ByteTrack目标跟踪器,ByteTrack与基于ReID特征进行匹配的目标跟踪方法不同,ByteTrack主要依赖目标检测器提供的目标框信息进行跟踪。因此,目标检测器的准确性和稳定性会直接影响到ByteTrack的跟踪效果。
通过supervision.ByteTrack类即可初始化ByteTrack追踪器,supervision.ByteTrack类的初始化参数如下:
- track_thresh(float, 可选,默认0.25): 检测置信度阈值
- track_buffer(int,可选,默认30): 轨道丢失时要缓冲的帧数。
- match_thresh(float,可选,默认0.8): 将轨道与检测相匹配的阈值。
- frame_rate(int,可选,默认30): 视频的帧速率。
supervision.ByteTrack类的主要类函数如下:
- reset():重置ByteTrack跟踪器的内部状态。
- update_with_detections(detections):使用提供的检测更新跟踪器并返回更新的检测结果,detections为supervision的目标检测结果。
示例代码如下:
import supervision as sv
from ultralytics import YOLO
import numpy as np
model = YOLO("yolov8n.pt")

# 初始化目标跟踪器
tracker = sv.ByteTrack()

bounding_box_annotator = sv.BoundingBoxAnnotator()
label_annotator = sv.LabelAnnotator()

def callback(frame: np.ndarray, index: int) -> np.ndarray:
    results = model(frame)[0]
    # 获得Detections结果
    detections = sv.Detections.from_ultralytics(results)
    # 轨迹跟踪
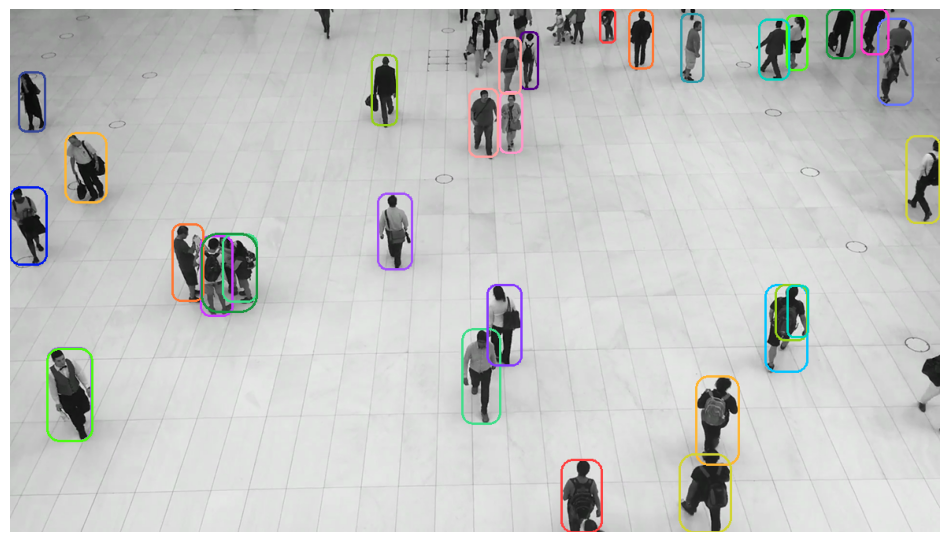
    detections = tracker.update_with_detections(detections)

    labels = [f"#{tracker_id}" for tracker_id in detections.tracker_id]

    annotated_frame = bounding_box_annotator.annotate(scene=frame.copy(), detections=detections)
    annotated_frame = label_annotator.annotate( scene=annotated_frame, detections=detections, labels=labels)
    return annotated_frame

sv.process_video(
    source_path="https://media.roboflow.com/supervision/video-examples/people-walking.mp4",
    # 输出结果参考:https://media.roboflow.com/supervision/video-examples/how-to/track-objects/annotate-video-with-traces.mp4
    target_path="output.mp4",
    callback=callback
)
由于示例代码用的是yolov8n.pt,跟踪效果会很不稳定,可以考虑使用性能更强的目标跟踪器。
1.3 图像分类
supervision支持分析clip,timm,YOLOv8分类模型结果的输出,但是功能很弱,仅支持输出top-k及概率。
以下代码输入图片如下:

import cv2
from ultralytics import YOLO
import supervision as sv

# 加载图片和模型
image = cv2.imread("img/cat.png")
# 加载分类模型
model = YOLO('yolov8n-cls.pt')

output = model(image)[0]
# 将YOLO的分类输出导入supervision
classifications = sv.Classifications.from_ultralytics(output)
# 除此之外还支持from_clip和from_timm两类模型

# 打印top2,输出类别和概率
print(classifications.get_top_k(2))
0: 224x224 tiger_cat 0.29, tabby 0.23, Egyptian_cat 0.15, Siamese_cat 0.05, Pembroke 0.03, 36.7ms
Speed: 6.3ms preprocess, 36.7ms inference, 0.0ms postprocess per image at shape (1, 3, 224, 224)
(array([282, 281]), array([    0.29406,     0.22982], dtype=float32))
2 数据展示与辅助处理
2.1 颜色设置
supervision提供Color类和ColorPalette类来设置颜色(调色板)和转换颜色。具体如下:
# 获得默认颜色
import supervision as sv

# WHITE BLACK RED GREEN	BLUE YELLOW	ROBOFLOW
sv.Color.ROBOFLOW
Color(r=163, g=81, b=251)
# 获得颜色的bgr值
sv.Color(r=255, g=255, b=0).as_bgr()
# 获得rgb值
# sv.Color(r=255, g=255, b=0).as_rgb()
(0, 255, 255)
# 获得颜色的16进制值
sv.Color(r=255, g=255, b=0).as_hex()
'#ffff00'
# 基于16进制色Color对象
sv.Color.from_hex('#ff00ff')
Color(r=255, g=0, b=255)
# 返回默认调色板
sv.ColorPalette.DEFAULT
# sv.ColorPalette.ROBOFLOW
# sv.ColorPalette.LEGACY
ColorPalette(colors=[Color(r=163, g=81, b=251), Color(r=255, g=64, b=64), Color(r=255, g=161, b=160), Color(r=255, g=118, b=51), Color(r=255, g=182, b=51), Color(r=209, g=212, b=53), Color(r=76, g=251, b=18), Color(r=148, g=207, b=26), Color(r=64, g=222, b=138), Color(r=27, g=150, b=64), Color(r=0, g=214, b=193), Color(r=46, g=156, b=170), Color(r=0, g=196, b=255), Color(r=54, g=71, b=151), Color(r=102, g=117, b=255), Color(r=0, g=25, b=239), Color(r=134, g=58, b=255), Color(r=83, g=0, b=135), Color(r=205, g=58, b=255), Color(r=255, g=151, b=202), Color(r=255, g=57, b=201)])
# 返回调试第i个颜色
color_palette = sv.ColorPalette.from_hex(['#ff0000', '#00ff00', '#0000ff'])
color_palette.by_idx(1)
Color(r=0, g=255, b=0)
# 从matpotlib导入调色板
sv.ColorPalette.from_matplotlib('tab20', 5)
ColorPalette(colors=[Color(r=31, g=119, b=180), Color(r=152, g=223, b=138), Color(r=140, g=86, b=75), Color(r=199, g=199, b=199), Color(r=158, g=218, b=229)])
2.2 识别结果可视化示例
supervision提供了多种函数来对识别结果进行可视化(主要针对目标检测和目标跟踪任务)。本文主要介绍目标检测边界框的各种展示效果。关于supervision所有数据注释可视化示例函数见:supervision-doc-annotators。
以下是主要示例:
# 获得数据结果
import cv2
import supervision as sv
from ultralytics import YOLO

model = YOLO("yolov8n.pt")
image = cv2.imread("img/person.png")
results = model(image, verbose=False)[0]
# 从YOLOv8中加载数据结果
detections = sv.Detections.from_ultralytics(results)
# 查看输出结果维度
len(detections)
32
目标框绘制
import supervision as sv

# 设置边界框绘制器
# 参数:color-设置颜色,thickness-线条粗细,color_lookup-颜色映射策略/选项有INDEX、CLASS、TRACK。
bounding_box_annotator = sv.BoundingBoxAnnotator(color= sv.ColorPalette.DEFAULT, thickness = 2, color_lookup = sv.ColorLookup.CLASS)
annotated_frame = bounding_box_annotator.annotate(
    scene=image.copy(),
    detections=detections
)

sv.plot_image(annotated_frame)

圆角目标框绘制
# roundness-边界框边缘的圆度百分比
round_box_annotator = sv.RoundBoxAnnotator(color_lookup = sv.ColorLookup.INDEX, roundness=0.6)

annotated_frame = round_box_annotator.annotate(
    scene=image.copy(),
    detections=detections
)

sv.plot_image(annotated_frame)

角点边界框绘制
import supervision as sv

# corner_length-每个角线的长度,
corner_annotator = sv.BoxCornerAnnotator(corner_length=12, color=sv.Color(r=255, g=255, b=0))
annotated_frame = corner_annotator.annotate(
    scene=image.copy(),
    detections=detections
)
sv.plot_image(annotated_frame)

遮罩边界框绘制
# 颜色遮罩的不透明度
color_annotator = sv.ColorAnnotator(opacity=0.4)
annotated_frame = color_annotator.annotate(
    scene=image.copy(),
    detections=detections
)
sv.plot_image(annotated_frame)

圆形边界框绘制
circle_annotator = sv.CircleAnnotator(color=sv.Color(r=255, g=255, b=128))
annotated_frame = circle_annotator.annotate(
    scene=image.copy(),
    detections=detections
)
sv.plot_image(annotated_frame)

点形边界框绘制
Supervision提供DotAnnotator绘制类以在图像上的目标检测框特定位置绘制关键点,该绘制类有两个独有参数:radius(点的半径),position(点在边界框上的绘制)。position可选参数如下:
- CENTER = “CENTER”
- CENTER_LEFT = “CENTER_LEFT”
- CENTER_RIGHT = “CENTER_RIGHT”
- TOP_CENTER = “TOP_CENTER”
- TOP_LEFT = “TOP_LEFT”
- TOP_RIGHT = “TOP_RIGHT”
- BOTTOM_LEFT = “BOTTOM_LEFT”
- BOTTOM_CENTER = “BOTTOM_CENTER”
- BOTTOM_RIGHT = “BOTTOM_RIGHT”
- CENTER_OF_MASS = “CENTER_OF_MASS”
通过代码查看position可选参数实现如下:
for i in sv.Position:
    print(i)
dot_annotator = sv.DotAnnotator(radius=4)
annotated_frame = dot_annotator.annotate(
    scene=image.copy(),
    detections=detections
)
sv.plot_image(annotated_frame)

三角形边界框绘制
# base/height-三角形的宽高,position-位置
triangle_annotator = sv.TriangleAnnotator(base = 30, height = 30, position = sv.Position['TOP_CENTER'])
annotated_frame = triangle_annotator.annotate(
    scene=image.copy(),
    detections=detections
)
sv.plot_image(annotated_frame)

椭圆形边界框绘制
# start_angle/end_angle-椭圆开始/结束角度
ellipse_annotator = sv.EllipseAnnotator(start_angle=-45, end_angle=215)
annotated_frame = ellipse_annotator.annotate(
    scene=image.copy(),
    detections=detections
)
sv.plot_image(annotated_frame)

置信度边界框绘制
# 用于展示置信度百分比
# border_color-百分比条颜色
# position-位置
# width/height-百分比条宽/高
percentage_bar_annotator = sv.PercentageBarAnnotator(border_color = sv.Color(r=128, g=0, b=0), position=sv.Position['BOTTOM_CENTER'],
                                                    width = 100, height = 20)
annotated_frame = percentage_bar_annotator.annotate(
    scene=image.copy(),
    detections=detections
)
sv.plot_image(annotated_frame)

文字描述框绘制
# color-文字背景色,text_color-文字颜色,text_scale-文字大小
# text_position-文字位置,text_thickness-文字粗细,text_padding-文字填充距离
label_annotator = sv.LabelAnnotator(color=sv.Color(r=255, g=255, b=255),text_color=sv.Color(r=128, g=0, b=128), text_scale=2,
                                    text_position=sv.Position.TOP_CENTER, text_thickness=2,text_padding=10)

# 获得各边界框的标签
labels = [
    model.model.names[class_id]
    for class_id
    in detections.class_id
]

annotated_frame = label_annotator.annotate(
    scene=image.copy(),
    detections=detections,
    labels=labels
)
sv.plot_image(annotated_frame)

像素化目标
# pixel_size-像素化的大小。
pixelate_annotator = sv.PixelateAnnotator(pixel_size=12)
annotated_frame = pixelate_annotator.annotate(
    scene=image.copy(),
    detections=detections
)
# 叠加其他边界框展示效果
annotated_frame = label_annotator.annotate(
    scene=annotated_frame.copy(),
    detections=detections,
    labels=labels
)
sv.plot_image(annotated_frame)

2.3 辅助函数
2.3.1 视频相关
读取视频信息
import supervision as sv
# 读取视频文件的宽度、高度、fps和总帧数。
video_info = sv.VideoInfo.from_video_path(video_path="https://media.roboflow.com/supervision/video-examples/people-walking.mp4")
video_info
VideoInfo(width=1920, height=1080, fps=25, total_frames=341)
视频读写
import supervision as sv
from tqdm import tqdm
video_path="https://media.roboflow.com/supervision/video-examples/people-walking.mp4"
video_info = sv.VideoInfo.from_video_path(video_path)
# 获取一个生成视频帧的生成器
# stride: 指示返回帧的时间间隔,默认为1
# start: 开始帧编号,默认为0
# end:结束帧编号,默认为None(一直到视频结束)
frames_generator = sv.get_video_frames_generator(source_path=video_path, stride=10, start=0, end=100)
TARGET_VIDEO_PATH = "out.avi"
# target_path保存路径
with sv.VideoSink(target_path=TARGET_VIDEO_PATH, video_info=video_info) as sink:
    for frame in tqdm(frames_generator):
        sink.write_frame(frame=frame)
10it [00:24, 2.47s/it]
fps计算
import supervision as sv

frames_generator = sv.get_video_frames_generator(source_path="https://media.roboflow.com/supervision/video-examples/people-walking.mp4")
# 初始化fps监视器
fps_monitor = sv.FPSMonitor()

for frame in frames_generator:
    # 添加时间戳
    fps_monitor.tick()
# 根据存储的时间戳计算并返回平均 FPS。
fps = fps_monitor.fps
fps
174.4186046525204
2.3.2 图像相关
# 保存图片
import supervision as sv
# 创建图像保存类
# target_dir_path-保存路径
# overwrite-是否是否覆盖保存路径,默认False
# image_name_pattern-图像文件名模式。 默认为“image_{:05d}.png”。
with sv.ImageSink(target_dir_path='output', overwrite=True, image_name_pattern= "img_{:05d}.png") as sink:
    for image in sv.get_video_frames_generator( source_path='out.avi', stride=2):
        sink.save_image(image=image)
# 根据给定的边界框裁剪图像。
import supervision as sv
import cv2
import supervision as sv
from ultralytics import YOLO

model = YOLO("yolov8n.pt")
image = cv2.imread("img/person.png")
results = model(image)[0]
# 从YOLOv8中加载数据结果
detections = sv.Detections.from_ultralytics(results)
with sv.ImageSink(target_dir_path='output') as sink:
    for xyxy in detections.xyxy:
        # 获得边界框裁剪图像
        cropped_image = sv.crop_image(image=image, xyxy=xyxy)
        sink.save_image(image=cropped_image)
0: 384x640 31 persons, 1 bird, 76.8ms
Speed: 2.5ms preprocess, 76.8ms inference, 2.7ms postprocess per image at shape (1, 3, 384, 640)
2.4 其他函数
supervision中还有其他常用类,本文将不对其进行详细介绍,具体情况如下:
- supervision提供了一种能够使各类数据集(主要是目标检测和图像分类)在不同格式之间相互转换的类:supervision-doc-datasets。
- supervision提供了计算目标检测结果各类分析指标的类:supervision-doc-metrics
- supervision提供绘制各种图形的类:supervision-doc-draw-utils
3 面向实际任务的工具
3.1 越线数量统计
supversion提供了LineZone类来实现越线数量统计功能,原理很简单就是目标检测+目标跟踪,然后根据车辆的边界框中心点来判断是否穿过预设线,从而实现越线数量统计。代码如下:
import supervision as sv
from ultralytics import YOLO

model = YOLO("yolov8n.pt")
tracker = sv.ByteTrack()
frames_generator = sv.get_video_frames_generator("https://media.roboflow.com/supervision/video-examples/vehicles.mp4",start=0,end=500)
video_info = sv.VideoInfo.from_video_path("https://media.roboflow.com/supervision/video-examples/vehicles.mp4")
w = video_info.width
h = video_info.height
# 设置预设线(从左至右)
start, end = sv.Point(x=0, y=int(h/2)), sv.Point(x=w, y=int(h/2))
# 初始预线检测器
line_zone = sv.LineZone(start=start, end=end)
# 初始化可视化对象
trace_annotator = sv.TraceAnnotator()
label_annotator = sv.LabelAnnotator(text_scale=2,text_color= sv.Color.BLACK)
line_zone_annotator = sv.LineZoneAnnotator(thickness=4, text_thickness=4, text_scale=1)
with sv.ImageSink(target_dir_path='output', overwrite=False, image_name_pattern= "img_{:05d}.png") as sink:
    for frame in frames_generator:
        result = model(frame)[0]
        detections = sv.Detections.from_ultralytics(result)
        # 更新目标跟踪器
        detections = tracker.update_with_detections(detections)
        # 更新预线检测器,crossed_in是否进入结果,crossed_out是否出去结果
        crossed_in, crossed_out = line_zone.trigger(detections)


        # 获得各边界框的标签
        labels = [
            f"#{tracker_id} {model.model.names[class_id]}"
            for class_id, tracker_id
            in zip(detections.class_id, detections.tracker_id)
        ]

        # 绘制轨迹
        annotated_frame = trace_annotator.annotate(scene=frame.copy(), detections=detections)
        # 绘制标签
        annotated_frame = label_annotator.annotate(scene=annotated_frame, detections=detections, labels=labels)
        # 绘制预制线
        annotated_frame = line_zone_annotator.annotate(annotated_frame, line_counter=line_zone)
        # 数据展示
        # sv.plot_image(annotated_frame)
        # 保存可视化结果
        # sink.save_image(image=annotated_frame)

# 从外到内越线的对象数量,从内到外越线的对象数量。
print(line_zone.in_count, line_zone.out_count)
# 代码输出结果见:https://media.roboflow.com/supervision/cookbooks/count-objects-crossing-the-line-result-1280x720.mp4
3.2 对特定区域进行检测跟踪
supversion提供了PolygonZone类来对特定区域进行检测跟踪,原理很简单就是目标检测或加上目标跟踪,然后选取特定区域来判断目标是否在此区域以及统计当前区域的目标个数。代码如下:
import numpy as np
import supervision as sv

from ultralytics import YOLO

model = YOLO('yolov8n.pt')

# 视频路径
video_path = "https://media.roboflow.com/supervision/video-examples/vehicles-2.mp4"
# 查看视频信息
video_info = sv.VideoInfo.from_video_path(video_path)
print(video_info)
# 读取视频
generator = sv.get_video_frames_generator(video_path)

# 设置要监控的区域
polygons = [
  np.array([
    [718, 595],[927, 592],[851, 1062],[42, 1059]
  ]),
  np.array([
    [987, 595],[1199, 595],[1893, 1056],[1015, 1062]
  ])
]


# 设置调色盘
colors = sv.ColorPalette.DEFAULT
zones = [
    # 定义多边形区域以检测对象。
    sv.PolygonZone(
        polygon=polygon, # 输入多边形
        frame_resolution_wh=video_info.resolution_wh # 全图尺寸
    )
    for polygon in polygons
]
# 初始化可视化对象
zone_annotators = [
    # 对不同监控区域分开进行可视化
    sv.PolygonZoneAnnotator(
        zone=zone,
        color=colors.by_idx(index), # 颜色
        thickness=4, # 线宽
        text_thickness=8, # 文本粗细
        text_scale=4, # 文本比例
        display_in_zone_count=False # 是否展示目标统计个数
    )
    for index, zone in enumerate(zones)
]
# 分开为检测区域定义不同的边界框展示
box_annotators = [
    sv.BoxAnnotator(
        color=colors.by_idx(index),
        thickness=4,
        text_thickness=4,
        text_scale=2
        )
    for index in range(len(polygons))
]

with sv.ImageSink(target_dir_path='output', overwrite=False, image_name_pattern= "img_{:05d}.png") as sink:
    for frame in generator:
        # 为提高识别精度,需要设置模型各大的输入尺寸
        results = model(frame, imgsz=1280, verbose=False)[0]
        detections = sv.Detections.from_ultralytics(results)

        for zone, zone_annotator, box_annotator in zip(zones, zone_annotators, box_annotators):
            # 确定哪些目标检测结果位于多边形区域
            mask = zone.trigger(detections=detections)
            detections_filtered = detections[mask]
            frame = box_annotator.annotate(scene=frame, detections=detections_filtered)
            frame = zone_annotator.annotate(scene=frame)
        # 数据展示
        sv.plot_image(frame, (16, 16))
        # 保存可视化结果
        # sink.save_image(image=annotated_frame)
# 代码输出结果见:https://blog.roboflow.com/content/media/2023/03/trim-counting.mp4
3.3 切片推理
supervision支持对图片进行切片推理以优化小目标识别,即基于SAHI(Slicing Aided Hyper Inference,切片辅助超推理)通过图像切片的方式来检测小目标。SAHI检测过程可以描述为:通过滑动窗口将图像切分成若干区域,各个区域分别进行预测,同时也对整张图片进行推理。然后将各个区域的预测结果和整张图片的预测结果合并,最后用NMS(非极大值抑制)进行过滤。SAHI的具体使用见:基于切片辅助超推理库SAHI优化小目标识别。
supervision通过SAHI进行切片推理的示例代码如下所示:
import cv2
import supervision as sv
from ultralytics import YOLO
import numpy as np

model = YOLO("yolov8n.pt")
image = cv2.imread("img/person.png")
results = model(image,verbose=False)[0]
# 从YOLOv8中加载数据结果
detections = sv.Detections.from_ultralytics(results)
# 查看输出结果维度
print("before slicer",len(detections))

# 切片回调函数
def callback(image_slice: np.ndarray) -> sv.Detections:
    result = model(image_slice,verbose=False)[0]
    return sv.Detections.from_ultralytics(result)

# 设置 Slicing Adaptive Inference(SAHI)处理对象
# callback-对于切片后每张子图进行处理的回调函数
# slice_wh-切片后子图的大小
# overlap_ratio_wh-连续切片之间的重叠率
# iou_threshold-子图合并时用于nms的iou阈值
# thread_workers-处理线程数
slicer = sv.InferenceSlicer(callback = callback, slice_wh=(320,320),
                            overlap_ratio_wh=(0.3,0.3), iou_threshold=0.4, thread_workers=4)

detections = slicer(image)
# 查看输出结果维度
print("after slicer",len(detections))
before slicer 32
after slicer 53
3.4 轨迹平滑
supervision提供了用于平滑视频跟踪轨迹的实用类DetectionsSmoother。 DetectionsSmoother维护每个轨迹的检测历史记录,并根据这些历史记录提供平滑的预测。具体代码如下:
import supervision as sv

from ultralytics import YOLO

video_path = "https://media.roboflow.com/supervision/video-examples/grocery-store.mp4"
video_info = sv.VideoInfo.from_video_path(video_path=video_path)
frame_generator = sv.get_video_frames_generator(source_path=video_path)

model = YOLO("yolov8n.pt")
tracker = sv.ByteTrack(frame_rate=video_info.fps)
# 跟踪结果平滑器,length-平滑检测时要考虑的最大帧数
smoother = sv.DetectionsSmoother(length=4)

annotator = sv.BoundingBoxAnnotator()

with sv.VideoSink("output.mp4", video_info=video_info) as sink:
    for frame in frame_generator:
        result = model(frame)[0]
        detections = sv.Detections.from_ultralytics(result)
        detections = tracker.update_with_detections(detections)
        # 平滑目标跟踪轨迹
        detections = smoother.update_with_detections(detections)

        annotated_frame = annotator.annotate(frame.copy(), detections)
        # 数据展示
        sv.plot_image(annotated_frame, (16, 16))
        # sink.write_frame(annotated_frame)

# 代码输出结果见:https://media.roboflow.com/supervision-detection-smoothing.mp4
4 参考

开放原子开发者工作坊旨在鼓励更多人参与开源活动,与志同道合的开发者们相互交流开发经验、分享开发心得、获取前沿技术趋势。工作坊有多种形式的开发者活动,如meetup、训练营等,主打技术交流,干货满满,真诚地邀请各位开发者共同参与!
更多推荐
 已为社区贡献15条内容


所有评论(0)