Leaflet【三】图层组 & geoJson & 热力图
图层组功能允许用户将多个图层组合在一起,便于管理和控制。GeoJSON是一种基于JSON的地理空间数据交换格式,可以用于在Leaflet中加载和显示地理数据。热力图则是一种可视化技术,用于表示地理数据的密度分布。通过结合使用这三个功能,可以实现在Leaflet中创建具有丰富地理信息和交互性的地图应用。
图层组 LayerGroup
用于将几个图层分组并作为一个整体处理。如果你把它添加到地图上,任何从该组中添加或删除的图层也会在地图上添加/删除。
L.layerGroup([marker1, marker2]).addTo(map);
使用图层组有什么好处呢?这个在后面有说到,这里的样例代码,我们原本是创建好的marker1、2直接通过addTo就加到了地图上,使用图层组将相当于把这两个图层放到一个集合当中,然后将整个集合一起渲染到地图上。关于图层组的方法可以查看–>
补充
图层组的优势是什么,第一点还是想到了性能问题。在上一篇文章当中渲染图片的地方可以看一下(对比一下图层组的性能)因为图层组还是多了一步统一管理时间上会稍微慢一点。
  console.time('执行时间');
  for (let i = 0; i < 100; i++) {
    for (let j = 0; j < 50; j++) {
      const bounds = [[(j - 1) * 5, (i - 1) * 5], [5 * j, 5 * i]];
      L.imageOverlay(`https://maps.lib.utexas.edu/maps/historical/newark_nj_1922.jpg`, bounds).addTo(map);
    }
  }
  console.timeEnd('执行时间');// 控制台输出 ---> 执行时间: 271.128173828125 ms


  console.time('执行时间');
  const arr = [];
  for (let i = 0; i < 100; i++) {
    for (let j = 0; j < 50; j++) {
      const bounds = [[(j - 1) * 5, (i - 1) * 5], [5 * j, 5 * i]];
      arr.push(L.imageOverlay(`https://maps.lib.utexas.edu/maps/historical/newark_nj_1922.jpg`, bounds));
    }
  }
  const layer = L.featureGroup(arr)
      .addTo(map);
  console.timeEnd('执行时间'); // 控制台输出 ---> 执行时间: 309.530029296875 ms
而图层组主要的思想还是化零为整,统一管理,例如我们的地图上有三种类型不同的点,我们需要去控制按类型做显示隐藏,利用图层组,将不同类型的点加到不同图层当中统一控制,案例如下:
const pointA = [] // 三种类型的数据
const pointB = []
const pointC = []

const layerListA = []
// 注意 纬度在前 经度在后
pointA.forEach(item => {layerListA.push(L.marker([item.lat, item.lon]))})
// ...... BC同理取layerListB layerListC
const layerA = L.featureGroup(layerListA).addTo(map);
const layerB = L.featureGroup(layerListB).addTo(map);
const layerC = L.featureGroup(layerListC).addTo(map);
// 控制隐藏 先将图层从地图当中移出
map.removeLayer(layerA);
// 不要使用 layer.clearLayers();  这个会将图层当中的数据清除掉,
// 重新渲染
map.add(layerA);
要素组 FeatureGroup
是对LayerGroup的扩展,使它更容易对其所有成员图层做同样的事情。
L.featureGroup([marker1, marker2, polyline])
    .bindPopup('Hello world!')
    .on('click', function() { alert('Clicked on a member of the group!'); })
    .addTo(map);
GeoJSON 图层
允许你解析 GeoJSON 数据并将其显示在地图上。扩展自FeatureGroup。其中geoJson数据可以在阿里云地图选择器 下载
import GUANGDONG from '@/assets/mapJson/guangdong.json';
import GUANGXI from '@/assets/mapJson/guangxi.json';
const gdLayer = L.geoJSON(GUANGDONG, {
  // 这个style是继承自Path的,也就是marker点、线面等等都是同一套样式控制
  style: {
    'color': '#f40',
    'weight': 1,
    'opacity': 0.8
  }
}).addTo(map);

// 可以直接通过addData方法加载geoJson数据到该图层当中
gdLayer.addData(GUANGXI)

热力图 HeatMap
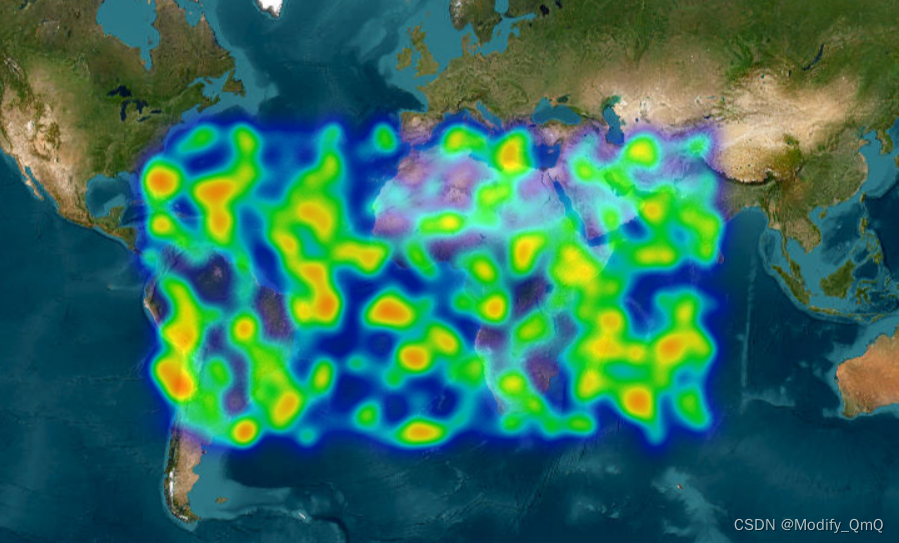
在leaflet官网当中提供了很多的插件->go,也包含了热力图的插件,这块使用的是Leaflet.heat插件,里面还有一些其他的热力图的插件 leaflet 热力图插件
安装依赖
npm i leaflet.heat
demo实现
import 'leaflet.heat';

const addHeat = () => {
  for (let i = 0; i < 1000; i++) {
    res.push([
      Math.random() * 80 - 40, // 纬度
      Math.random() * 160 - 80, // 经度
      Math.random() * 3000 + '' // 值
    ]);
  }
  const layerHeat = L.heatLayer(heatPoint, {radius: 10});
  map.addLayer(layerHeat);
}

leaflet-heat插件扩展
源码所在位置:node_modules/leaflet.heat/src/HeatLayer.js
首先里面定义了这个L.HeatLayer,这也是我们为什么可以直接用的原因,其次这个继承于Layer基类。
L.HeatLayer = (L.Layer ? L.Layer : L.Class).extend({})
在leaflet当中的Layer基类和Class基类当中有一些拓展方法和属性,这里简单罗列一下,后面看源码会用到这个方法
| Layer基类方法 | 说明 |
|---|---|
| onAdd(Map map) | 应该包含为图层创建 DOM 元素的代码,将它们添加到应该属于它们的地图窗格中,并在相关的地图事件上放置listeners。在map.addLayer(layer)执行的时候会调用 |
| onRemove(Map map) | 应该包含所有的清理代码,将图层的元素从DOM中移除,并移除之前在 onAdd中添加的 listeners。在 map.removeLayer(layer)上调用。 |
| getEvents() | 这个可选的方法应该返回一个类似 { viewreset: this._reset } 的对象,用于 addEventListener。这个对象中的事件处理程序将随你的图层自动添加和删除。 |
| getAttribution() | 这个可选的方法应该返回一个包含 HTML 的字符串,只要该图层是可见的,就会显示在 Attribution 控件 上。 |
| beforeAdd(Map map) | 可选的方法。在 map.addLayer(layer)上调用,在图层被添加到地图之前,在事件被初始化之前,无需等待地图处于可用状态。只用于早期初始化。 |
| Class基类方法和属性 | 说明 |
|---|---|
| initialize() | 构造函数 |
| options | 你传递给到 extend 将与父对象合并,而不是完全覆盖它(入参的options和自定义的options会增量覆盖) |
初始化实例
初始化实例的时候:const layerHeat = L.heatLayer(heatPoint, {radius: 10});。
这使用的时候调用的heatLayer会去实例一个HeatLayer。由于其继承了Class基类,那么就会去执行initialize(构造)
L.heatLayer = function (latlngs, options) {
    return new L.HeatLayer(latlngs, options);
};

// 执行构造,将经纬度数据存一下,然后合并options配置。
initialize: function (latlngs, options) {
  this._latlngs = latlngs;
  L.setOptions(this, options);
},
添加图层
初始化实例之后,我们会使用map.addLayer(layerHeat) 把图层渲染到地图上。
前面有写,这个时候就会去执行Layer基类的onAdd方法,
onAdd: function (map) {
  this._map = map;

  // 初始化一个canvas对象
  if (!this._canvas) {
    this._initCanvas();
  }

  // 将canvas对象渲染到页面上
  map._panes.overlayPane.appendChild(this._canvas);

  // 监听地图移动事件
  map.on('moveend', this._reset, this);

  if (map.options.zoomAnimation && L.Browser.any3d) {
    map.on('zoomanim', this._animateZoom, this);
  }

  this._reset();
}
初始化canvas
这里就是创建好一个canvas对象,之后通过simpleheat把canvas转换成热力图canvas,其中simpleheat 这是一个超小型的JavaScript库,用于使用Canvas绘制热图。可以在那个npm上看一下,最后还有一个_updateOptions方法,这个就是将使用者的options配置拿过来存到_heat当中。
_initCanvas: function () {
  var canvas = this._canvas = L.DomUtil.create('canvas', 'leaflet-heatmap-layer leaflet-layer');

  var originProp = L.DomUtil.testProp(['transformOrigin', 'WebkitTransformOrigin', 'msTransformOrigin']);
  canvas.style[originProp] = '50% 50%';

  var size = this._map.getSize();
  canvas.width = size.x;
  canvas.height = size.y;

  var animated = this._map.options.zoomAnimation && L.Browser.any3d;
  L.DomUtil.addClass(canvas, 'leaflet-zoom-' + (animated ? 'animated' : 'hide'));

  this._heat = simpleheat(canvas);
  this._updateOptions();
}

_updateOptions: function () {
  this._heat.radius(this.options.radius || this._heat.defaultRadius, this.options.blur);

  if (this.options.gradient) {
    this._heat.gradient(this.options.gradient);
  }
  if (this.options.max) {
    this._heat.max(this.options.max);
  }
}
重绘canvas
在onAdd入口当中,不管是地图被拖动还是第一次都会执行该方法,也就是将canvas对象的位置给设置一下,其中containerPointToLayerPoint 方法是给定相对于地图container容器的像素坐标,返回相对于origin pixel的相应像素坐标(返回地图层左上角的投影像素坐标),简单理解就是给canvas加一下定位。
_reset: function () {
  var topLeft = this._map.containerPointToLayerPoint([0, 0]);
  L.DomUtil.setPosition(this._canvas, topLeft);

  var size = this._map.getSize();

  if (this._heat._width !== size.x) {
    this._canvas.width = this._heat._width  = size.x;
  }
  if (this._heat._height !== size.y) {
    this._canvas.height = this._heat._height = size.y;
  }

  this._redraw();
}
绘制热力图
因为前面创建的canvas是一个simpleheat,而这个库绘制热力图的话是通过heat.data(data),这里主要就是组装这个data数据,最后通过this._heat.data(data) 把热力图渲染到canvas上,canvas是一个DOM元素结构,他是叠加在地图上的一层canvas,这里改变地图不会改变也就完成了热力图的渲染。
_redraw: function () {
  var data = [],
    r = this._heat._r,
    size = this._map.getSize(),
    bounds = new L.Bounds(
      L.point([-r, -r]),
      size.add([r, r])),

    max = this.options.max === undefined ? 1 : this.options.max,
    maxZoom = this.options.maxZoom === undefined ? this._map.getMaxZoom() : this.options.maxZoom,
    v = 1 / Math.pow(2, Math.max(0, Math.min(maxZoom - this._map.getZoom(), 12))),
    cellSize = r / 2,
    grid = [],
    panePos = this._map._getMapPanePos(),
    offsetX = panePos.x % cellSize,
    offsetY = panePos.y % cellSize,
    i, len, p, cell, x, y, j, len2, k;

  // console.time('process');
  for (i = 0, len = this._latlngs.length; i < len; i++) {
    p = this._map.latLngToContainerPoint(this._latlngs[i]);
    if (bounds.contains(p)) {
      x = Math.floor((p.x - offsetX) / cellSize) + 2;
      y = Math.floor((p.y - offsetY) / cellSize) + 2;

      var alt =
        this._latlngs[i].alt !== undefined ? this._latlngs[i].alt :
          this._latlngs[i][2] !== undefined ? +this._latlngs[i][2] : 1;
      k = alt * v;

      grid[y] = grid[y] || [];
      cell = grid[y][x];

      if (!cell) {
        grid[y][x] = [p.x, p.y, k];

      } else {
        cell[0] = (cell[0] * cell[2] + p.x * k) / (cell[2] + k); // x
        cell[1] = (cell[1] * cell[2] + p.y * k) / (cell[2] + k); // y
        cell[2] += k; // cumulated intensity value
      }
    }
  }

  for (i = 0, len = grid.length; i < len; i++) {
    if (grid[i]) {
      for (j = 0, len2 = grid[i].length; j < len2; j++) {
        cell = grid[i][j];
        if (cell) {
          data.push([
            Math.round(cell[0]),
            Math.round(cell[1]),
            Math.min(cell[2], max)
          ]);
        }
      }
    }
  }
  // console.timeEnd('process');

  // console.time('draw ' + data.length);
  this._heat.data(data).draw(this.options.minOpacity);
  // console.timeEnd('draw ' + data.length);

  this._frame = null;
}
总结
在这里原本是想看热力图是怎么绘制到canvas上的,但是底层又是通过另外一个库实现的,这个插件的源码分析主要还是看一下一个插件是怎么运行的,然后后续如果我们自己也需要去封装插件的话也可以使用该方法去实现,以及再看一些别人的插件如何去看插件的运行逻辑。

开放原子开发者工作坊旨在鼓励更多人参与开源活动,与志同道合的开发者们相互交流开发经验、分享开发心得、获取前沿技术趋势。工作坊有多种形式的开发者活动,如meetup、训练营等,主打技术交流,干货满满,真诚地邀请各位开发者共同参与!
更多推荐
 已为社区贡献11条内容


所有评论(0)