
数据分析三剑客之一:Pandas详解与实战
Pandas 是一个开源的第三方 Python 库,从 Numpy 和 Matplotlib 的基础上构建而来,享有数据分析“三剑客之一”的盛名(NumPy、Matplotlib、Pandas)。Pandas 已经成为 Python 数据分析的必备高级工具,它的目标是成为强大、灵活、可以支持任何编程语言的数据分析工具。
目录
3.2.13 DataFrame属性方法info(),index,coloumns,values ,axes
3.2.14 head()&tail()查看DataFrame数据
3.2.17 ndim&shape查看DataFrame维数和维度
3.2.19 T(Transpose)对DataFrame转置
3.4.1 以 (row_index,row) 的形式遍历行iterrows():
3.4.2 使用已命名元组的方式遍历行itertuples()
3.5.1 axis=0, ascending=True 默认按“行标签”升序排列
1 Pandas介绍
Pandas 是一个开源的第三方 Python 库,从 Numpy 和 Matplotlib 的基础上构建而来,享有数据分析“三剑客之一”的盛名(NumPy、Matplotlib、Pandas)。Pandas 已经成为 Python 数据分析的必备高级工具,它的目标是成为强大、灵活、可以支持任何编程语言的数据分析工具。Pandas具有如下特点:
- DataFrame是一种高效快速的数据结构模式,Pandas支持DataFrame格式,从而可以自定义索引
- 可以将不同格式的数据文件加载到内存中
- 未对齐及其索引方式不同的数据可按轴自动对齐
- 可处理时间序列或非时间序列数据
- 可基于标签来切片索引,获得大数据集子集
- 可进行高性能数据分组、聚合、添加、删除
- 灵活处理数据缺失、重组、空格
Pandas广泛用于金融、经济、数据分析、统计等商业领域,为各个领域数据从业者提供了便捷。
官网地址:https://pandas.pydata.org/
2 Pandas的安装与导入
2.1 Pandas模块安装
Python自带的包管理工具pip来安装:
pip install pandas2.2 Pandas模块导入
Pandas的导入
import pandas as pd
import numpy as np   # pandas和numpy常常结合在一起使用
3 pandas数据结构及函数
构建和处理二维、多维数组是一项繁琐的任务。Pandas 为解决这一问题, 在 ndarray 数组(NumPy 中的数组)的基础上构建出了两种不同的数据结构,分别是 Series(一维数据结构)和 DataFrame(二维数据结构):
- Series 是带标签的一维数组,这里的标签可以理解为索引,但这个索引并不局限于整数,它也可以是字符类型,比如 a、b、c 等;
- DataFrame 是一种表格型数据结构,它既有行标签,又有列标签。
| 数据结构 | 维度 | 说明 |
| Series | 1 | 该结构能够存储各种数据类型,比如字符数、整数、浮点数、Python 对象等,Series 用 name 和 index 属性来描述 数据值。Series 是一维数据结构,因此其维数不可以改变。 |
| DataFrame | 2 | DataFrame 是一种二维表格型数据的结构,既有行索引,也有列索引。行索引是 index,列索引是 columns。 在创建该结构时,可以指定相应的索引值。 |
3.1 Series结构
Series 结构,也称Series序列,是Pandas常用的数据结构之一,它是一种类似于一维数组的结构,由一组数据值(value)和一组标签组成,其中标签与数据值之间是一一对应的关系。
Series 可以保存任何数据类型,比如整数、字符串、浮点数、Python 对象等,它的标签默认为整数,从 0 开始依次递增。Series 的结构图,如下所示:
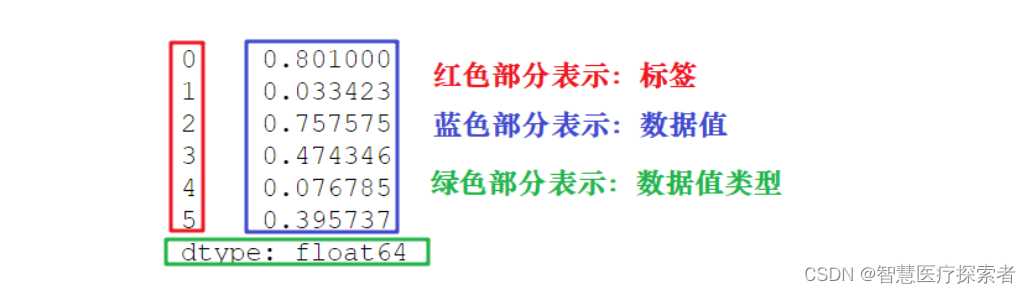
通过标签我们可以更加直观地查看数据所在的索引位置。
函数原型:
pandas.Series( data, index, dtype, copy)参数说明:
#data    输入的数据,可以是列表、常量、ndarray 数组等。
#index    索引值必须是惟一的,如果没有传递索引,则默认为 #np.arrange(n)。
#dtype    dtype表示数据类型,如果没有提供,则会自动判断得出。
#copy     表示对 data 进行拷贝,默认为 False。
可以用数组、字典、标量值或者 Python 对象来创建 Series 对象
Series 访问数据分为两种方式,一种是位置索引访问;另一种是标签索引访问。
Series 的常用属性和方法。在下表列出了 Series 对象的常用属性
| 名称 | 属性 |
| axes | 以列表的形式返回所有行索引标签 |
| dtype | 返回对象的数据类型 |
| empty | 判断Series对象是否为空 |
| ndim | 返回输入数据的维数 |
| size | 返回输入数据的元素数量 |
| values | 以ndarray的形式返回Series对象 |
| index | 返回一个RangeIndex对象,用来描述索引的取值范围。 |
3.1.1 ndarray创建Series对象
import pandas as pd
import numpy as np
data = np.array(['a', 'b', 'c', 'd'])

# 使用默认索引,创建 Series 序列对象
s1 = pd.Series(data)
print(f'默认索引:\n{s1}')

# 使用“显式索引”的方法自定义索引标签
s2 = pd.Series(data, index=[100, 101, 102, 103])
print(f'自定义索引\n{s2}')
运行结果显示如下:
默认索引:
0    a
1    b
2    c
3    d
dtype: object

自定义索引
100    a
101    b
102    c
103    d
dtype: object
示例中s1没有传递任何索引,所以索引默认从 0 开始分配 ,其索引范围为 0 到len(data)-1。
3.1.2 dict创建Series对象
把 dict 作为输入数据。如果没有传入索引时会按照字典的键来构造索引;反之,当传递了索引时需要将索引标签与字典中的值一一对应。
import pandas as pd
import numpy as np

data = {'a': 0, 'b': 1, 'c': 2}

# 没有传递索引时 会按照字典的键来构造索引
s1_dict = pd.Series(data)
print(f'没有传递索引\n{s1_dict}')

# 字典类型传递索引时 索引时需要将索引标签与字典中的值一一对应
# 当传递的索引值无法找到与其对应的值时,使用 NaN(非数字)填充
s2_dict = pd.Series(data, index=['a', 'b', 'c', 'd'])
print(f'传递索引\n{s2_dict}')
运行结果显示如下:
没有传递索引
a    0
b    1
c    2
dtype: int64

传递索引
a    0.0
b    1.0
c    2.0
d    NaN
dtype: float64
3.1.3 标量创建Series对象
import pandas as pd
import numpy as np

# 如果data是标量值,则必须提供索引: 标量值按照 index 的数量进行重复,并与其一一对应
s3 = pd.Series(6, index=[0,1,2,3])
print(f'标量值,则必须提供索引\n{s3}')
运行结果显示如下:
标量值,则必须提供索引
0    6
1    6
2    6
3    6
dtype: int64
3.1.4 位置索引访问Series数据
import pandas as pd

s = pd.Series([1, 2, 3, 4, 5], index=['a', 'b', 'c', 'd', 'e'])
print(f'Series数据\n{s}')

# 位置索引 第一个位置索引:0
print(f'位置索引={s[0]}')

# 标签索引 第一个标签索引:a
print(f'标签索引={s["a"]}')#

# 通过切片的方式访问 Series 序列中的数据
print(f'前两个元素\n{s[:2]}')

print(f'最后三个元素\n{s[-3:]}')
运行结果显示如下:
Series数据
a    1
b    2
c    3
d    4
e    5
dtype: int64
位置索引=1
标签索引=1
前两个元素
a    1
b    2
dtype: int64
最后三个元素
c    3
d    4
e    5
dtype: int64
3.1.5 标签索引访问Series数据
Series 类似于固定大小的 dict,把 index 中的索引标签当做 key,而把 Series 序列中的元素值当做 value,然后通过 index 索引标签来访问或者修改元素值。
import pandas as pd

s = pd.Series([1, 2, 3, 4, 5],index=['a', 'b', 'c', 'd', 'e'])
print(f'Series数据\n{s}')

# 标签索引访问单个元素
print(f'标签索引访问单个元素={s["a"]}')

# 标签索引访问多个元素
print(f'标签索引访问多个元素\n{s[["a","b","c"]]}')
运行结果显示如下:
Series数据
a    1
b    2
c    3
d    4
e    5
dtype: int64
标签索引访问单个元素=1
标签索引访问多个元素
a    1
b    2
c    3
dtype: int64
访问不包括的标签会抛出异常
3.1.6 Series常用属性axes
import pandas as pd
import numpy as np

s = pd.Series(np.random.randn(5))
print(f'默认索引\n{s}')

s1 = pd.Series(np.random.randn(5), index=['a', 'b', 'c', 'd', 'e'])
print(f'自定义索引\n{s1}')

# axes以列表的形式返回所有行索引标签
print(f'默认索引:{s.axes}')
print(f'自定义索引:{s1.axes}')
运行结果显示如下:
默认索引
0    0.327024
1    0.679870
2    0.714354
3   -0.215886
4   -1.857184
dtype: float64
自定义索引
a   -0.375701
b   -1.400197
c   -0.187348
d   -0.853269
e    0.129702
dtype: float64
默认索引:[RangeIndex(start=0, stop=5, step=1)]
自定义索引:[Index(['a', 'b', 'c', 'd', 'e'], dtype='object')]
3.1.7 Series常用属性index
import pandas as pd
import numpy as np

s = pd.Series(np.random.randn(5))
print(f'默认索引\n{s}')

s1 = pd.Series(np.random.randn(5), index=['a', 'b', 'c', 'd', 'e'])
print(f'自定义索引\n{s1}')

# index返回一个RangeIndex对象,用来描述索引的取值范围
print(f'默认索引:{s.index}')

#
print(f'自定义索引:{s1.index}')

# 通过.index.values 获取索引列表
print(s.index.values)
print(s1.index.values)
运行结果显示如下:
默认索引
0    0.200998
1    0.469934
2    0.096422
3   -0.399627
4    0.783720
dtype: float64
自定义索引
a   -1.639293
b   -0.128694
c   -0.940741
d   -1.547780
e    0.670969
dtype: float64
默认索引:RangeIndex(start=0, stop=5, step=1)
自定义索引:Index(['a', 'b', 'c', 'd', 'e'], dtype='object')
[0 1 2 3 4]
['a' 'b' 'c' 'd' 'e']
3.1.8 Series常用属性values
import pandas as pd
import numpy as np

s = pd.Series(np.random.randn(5))
print(f'默认索引\n{s}')

# values以数组的形式返回Series对象中的数据。
print(s.values)
运行结果显示如下:
默认索引
0   -0.772736
1   -0.473425
2   -0.588307
3    0.723052
4    0.601033
dtype: float64
[-0.77273598 -0.47342456 -0.5883065   0.72305156  0.60103283]
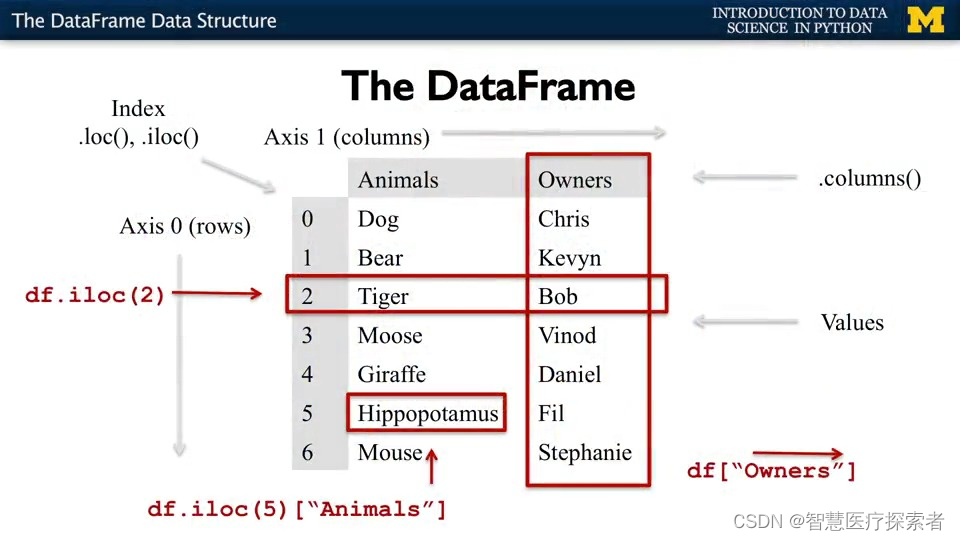
3.2 DataFrame结构
DataFrame一个表格型的数据结构,既有行标签(index),又有列标签(columns),它也被称异构数据表,所谓异构,指的是表格中每列的数据类型可以不同,比如可以是字符串、整型或者浮点型等。其结构图示意图,如下所示:
函数原型如下:
pandas.DataFrame( data, index, columns, dtype, copy)参数说明:
data       输入的数据,可以是 ndarray,series,list,dict,标量以及一个 DataFrame。
index      行标签,如果没有传递 index 值,则默认行标签是 np.arange(n),n 代表 data 的元素个数。
columns    列标签,如果没有传递 columns 值,则默认列标签是 np.arange(n)。
dtype      dtype表示每一列的数据类型。
copy       默认为 False,表示复制数据 data。
DataFrame 的属性和方法,如下所示:
| 名称 | 属性&方法描述 |
| index | 返回行索引 |
| coloumns | 返回列索引 |
| values | 使用numpy数组表示Dataframe中的元素值 |
| head() | 返回前 n 行数据。 |
| tail() | 返回后 n 行数据。 |
| axes | 返回一个仅以行轴标签和列轴标签为成员的列表。 |
| dtypes | 返回每列数据的数据类型。 |
| empty | DataFrame中没有数据或者任意坐标轴的长度为0,则返回True。 |
| ndim | 轴的数量,也指数组的维数。 |
| shape | DataFrame中的元素数量。 |
| shift() | 将行或列移动指定的步幅长度 |
| T | 行和列转置。 |
| info() | 返回相关的信息:行数 列数,列索引 列非空值个数, 列类型 |
3.2.1 列表创建DataFame对象
import pandas as pd

# 单一列表创建 DataFrame
data = [1, 2, 3]
df1 = pd.DataFrame(data)
print(f'单一列表\n{df1}')

# 使用嵌套列表创建 DataFrame 对象
data = [['java', '10'], ['python', '20'], ['C++', '30']]
df2 = pd.DataFrame(data)
print(f'嵌套列表创建\n{df2}')

# 指定数值元素的数据类型为float: 并指定columns
df3 = pd.DataFrame(data, columns=['name', 'age'], dtype=(str, float))
print(f'指定数据类型和colums\n{df3}')
运行结果显示如下:
单一列表
   0
0  1
1  2
2  3
嵌套列表创建
        0   1
0    java  10
1  python  20
2     C++  30
指定数据类型和colums
     name age
0    java  10
1  python  20
2     C++  30
3.2.2 字典嵌套列表创建DataFrame对象
data字典中,键对应值的元素长度必须相等(也就是列表的长度相等),如果传递索引那么索引的长度必须等于列表的长度;如果没有传递索引,默认情况下 索引应为range(n)。n代表的列表的长度
import pandas as pd

data = {'Name': ['Tom', 'Jack', 'Steve', 'Ricky'], 'Age': [28, 34, 29, 42]}
df1 = pd.DataFrame(data)
print(f'默认索引\n{df1}')

df2 = pd.DataFrame(data, index=['a', 'b', 'c', 'd'])
print(f'自定义索引\n{df2}')
运行结果显示如下:
默认索引
    Name  Age
0    Tom   28
1   Jack   34
2  Steve   29
3  Ricky   42
自定义索引
    Name  Age
a    Tom   28
b   Jack   34
c  Steve   29
d  Ricky   42
3.2.3 列表嵌套字典创建DataFrame对象
列表嵌套字典作为传入的值时,默认情况下 字典的键作为名(coloumns)
注意:如果某个元素的值缺失,也就是字典的key无法找到对应的Value,将使用NaN代替
import pandas as pd

# 字典的键被用作列名 如果其中某个元素值缺失,也就是字典的 key 无法找到对应的 value,将使用 NaN 代替。
data = [{'a': 1, 'b': 2}, {'a': 5, 'b': 10, 'c': 20}]
df1 = pd.DataFrame(data)
print(df1)

# 自定义行标签索引
df2 = pd.DataFrame(data, index=['first', 'second'])
print(df2)

# 如果列名 在字典键中不存在,所以对应值为 NaN。
df3 = pd.DataFrame(data, index=['first', 'second'], columns=['a', 'b'])
df4 = pd.DataFrame(data, index=['first', 'second'], columns=['a', 'b1'])
print(f'df3的列名在字典键中存在\n{df3}')
print(f'df4的列名b1在字典键不中存在\n{df4}')
运行结果显示如下:
   a   b     c
0  1   2   NaN
1  5  10  20.0

        a   b     c
first   1   2   NaN
second  5  10  20.0

df3的列名在字典键中存在
        a   b
first   1   2
second  5  10

df4的列名b1在字典键不中存在
        a  b1
first   1 NaN
second  5 NaN
3.2.4 Series创建DataFrame对象
传递一个字典形式的 Series,从而创建一个 DataFrame 对象,其输出结果的行索引是所有 index 的合集
import pandas as pd

# Series创建DataFrame对象 其输出结果的行索引是所有index的合集
data = {'one': pd.Series([1, 2, 3], index=['a', 'b', 'c']),
        'two': pd.Series([1, 2, 3, 4], index=['a', 'b', 'c', 'd'])}
df = pd.DataFrame(data)
print(df)
运行结果显示如下:
   one  two
a  1.0    1
b  2.0    2
c  3.0    3
d  NaN    4
3.2.5 列索引选取DataFrame数据
DataFrame 可以使用列索引(columns index)来完成数据的选取、添加和删除操作
import pandas as pd

data = [['java', 10, 9], ['python', 20, 100], ['C++', 30, 50]]
df1 = pd.DataFrame(data, columns=['name', 'age', 'number'])
print(f'数据df1\n{df1}')

# 获取数据方式一:使用列索引,实现数据获取某一行数据 df[列名]等于df.列名
print(f'通过df1.name方式获取\n{df1.name}')
print(f'通过df1["name"]方式获取\n{df1["name"]}')

# 获取数据方式二:使用列索引,实现数据获取某多行数据 df[list]
print(f'通过df[list]方式获取多列数据\n{df1[["name","number"]]}')

# 获取数据方式三:使用布尔值筛选获取某行数据
# 不同的条件用()包裹起来,并或非分别使用&,|,~而非and,or,not
print(f'获取name=python的数据\n{df1[df1["name"]=="python"]}')

print(f'获取age大于等于20的数据\n{df1[df1["age"]>=20]}')

print(f'获取name=python的数据或者是age等于30\n{df1[(df1["name"]=="python") | (df1["age"]==30)]}')
运行结果显示如下:
数据df1
     name  age  number
0    java   10       9
1  python   20     100
2     C++   30      50

通过df1.name方式获取
0      java
1    python
2       C++
Name: name, dtype: object

通过df1["name"]方式获取
0      java
1    python
2       C++
Name: name, dtype: object

通过df[list]方式获取多列数据
     name  number
0    java       9
1  python     100
2     C++      50

获取name=python的数据
     name  age  number
1  python   20     100

获取age大于等于20的数据
     name  age  number
1  python   20     100
2     C++   30      50

获取name=python的数据或者是age等于30
     name  age  number
1  python   20     100
2     C++   30      50
3.2.6 列索引添加DataFrame数据
使用 columns 列索引表标签可以实现添加新的数据列
import pandas as pd

# 列索引添加数据列
data = {'one': [1, 2, 3], 'two': [2, 3, 4]}
df1 = pd.DataFrame(data, index=['a', 'b', 'c'])
print(f'原数据\n{df1}')

# 方式一:使用df['列']=值,插入新的数据列
df1['three'] = pd.Series([10, 20, 30], index=list('abc'))
print(f'使用df["列"]=值,插入新的数据\n{df1}')

# 方式二:#将已经存在的数据列做相加运算
df1['four'] = df1['one']+df1['three']
print(f'将已经存在的数据列做相加运算\n{df1}')

# 方式三:使用 insert() 方法插入新的列
# 数值4代表插入到columns列表的索引位置
df1.insert(4, column='score', value=[50, 60, 70])
print(f'使用insert()方法插入\n{df1}')
运行结果显示如下:
原数据
   one  two
a    1    2
b    2    3
c    3    4
使用df["列"]=值,插入新的数据
   one  two  three
a    1    2     10
b    2    3     20
c    3    4     30
将已经存在的数据列做相加运算
   one  two  three  four
a    1    2     10    11
b    2    3     20    22
c    3    4     30    33
使用insert()方法插入
   one  two  three  four  score
a    1    2     10    11     50
b    2    3     20    22     60
c    3    4     30    33     70
3.2.7 列索引删除DataFrame数据
通过del和pop()都能够删除DataFrame中的数据列
import pandas as pd

data = {'one': [1, 2, 3], 'two': [20, 30, 40], 'three': [20, 30, 40]}
df1 = pd.DataFrame(data, index=['a', 'b', 'c'])
print(f'原数据\n{df1}')

# 方式一 del 删除某一列
del df1["one"]
print(f'通过del df["列名"]删除\n{df1}')

# 方式er pop() 删除某一列
df1.pop("two")
print(f'通过pop("列名")删除\n{df1}')
运行结果显示如下:
原数据
   one  two  three
a    1   20     20
b    2   30     30
c    3   40     40

通过del df["列名"]删除
   two  three
a   20     20
b   30     30
c   40     40

通过pop("列名")删除
   three
a     20
b     30
c     40
3.2.8 行标签索引选取DataFrame数据
可以将行标签传递给 loc 函数,来选取数据,loc 允许接两个参数分别是行和列,参数之间需要使用“逗号”隔开,但该函数只能接收标签索引。
import pandas as pd

data = {'one': [1, 2, 3, 4], 'two': [20, 30, 40, 50], 'three': [60, 70, 80, 90]}
df1 = pd.DataFrame(data, index=['a', 'b', 'c', 'd'])
print(f'原数据\n{df1}')

# 取某一行数据
print(f'取某一行数据\n{df1.loc["a"]}')

# loc允许接两个参数分别是行和列,参数之间需要使用“逗号”隔开,但该函数只能接收标签索引
# 获取某一个单元格的数据
print(f"取某一个单元格的数据\n{df1.loc['a','two']}")

# 更改某一个单元格的数据
df1.loc['a', 'two'] = 'abc'
print(f"更改后的数据\n{df1}")
运行结果显示如下:
原数据
   one  two  three
a    1   20     60
b    2   30     70
c    3   40     80
d    4   50     90

取某一行数据
one       1
two      20
three    60
Name: a, dtype: int64

取某一个单元格的数据
20

更改后的数据
   one  two  three
a    1  abc     60
b    2   30     70
c    3   40     80
d    4   50     90
3.2.9 整数索引选取DataFrame数据
通过将数据行所在的索引位置传递给 iloc 函数,也可以实现数据行选取。iloc 允许接受两个参数分别是行和列,参数之间使用“逗号”隔开,但该函数只能接收整数索引。
import pandas as pd

data = {'one': [1, 2, 3, 4], 'two': [20, 30, 40, 50],'three': [60, 70, 80, 90]}
df1 = pd.DataFrame(data,index=['a', 'b', 'c', 'd'])
print(f'原数据\n{df1}')

# 取某一行的数据 索引是从0开始
print(f'取某一行的数据\n{df1.iloc[0]}')
运行结果显示如下:
原数据
   one  two  three
a    1   20     60
b    2   30     70
c    3   40     80
d    4   50     90
取某一行的数据
one       1
two      20
three    60
Name: a, dtype: int64
3.2.10 切片操作多行选取DataFrame数据
loc 允许接两个参数分别是行和列,参数之间需要使用“逗号”隔开,但该函数只能接收标签索引。
iloc 允许接受两个参数分别是行和列,参数之间使用“逗号”隔开,但该函数只能接收整数索引。
import pandas as pd

data = {'one': [1, 2, 3, 4], 'two': [20, 30, 40, 50], 'three': [60, 70, 80, 90]}
df1 = pd.DataFrame(data,index=['a', 'b', 'c', 'd'])
print(f'原数据\n{df1}')

# loc[] 允许接两个参数分别是行和列,参数之间需要使用“逗号”隔开,但该函数只能接收标签索引
print(f"#loc[]方式获取第三行最后两列数据\n{df1.loc['c','two':'three']}")

# iloc[] 允许接受两个参数分别是行和列,参数之间使用“逗号”隔开,但该函数只能接收整数索引。
print(f"#iloc[]方式获取第三行最后两列数据\n{df1.iloc[2,1:3]}")
运行结果显示如下:
原数据
   one  two  three
a    1   20     60
b    2   30     70
c    3   40     80
d    4   50     90

#loc[]方式获取第三行最后两列数据
two      40
three    80
Name: c, dtype: int64

#iloc[]方式获取第三行最后两列数据
two      40
three    80
Name: c, dtype: int64
3.2.11 添加DataFrame数据行
使用append()函数,可以将新的数据行添加到DataFrame中,该函数会在行末追加数据行
import pandas as pd

data = {'one': [1, 2, 3, 4], 'two': [20, 30, 40, 50], 'three': [60, 70, 80, 90]}
df1 = pd.DataFrame(data, index=['a', 'b', 'c', 'd'])
print(f'#原数据\n{df1}')

df2 = pd.DataFrame({'one': 'Q', 'two': 'W'}, index=['e'])

# 使用append()返回一个新的是DataFrame的对象
df = df1._append(df2)
print(f'#在行末追加新数据行\n{df}')
运行结果显示如下:
#原数据
   one  two  three
a    1   20     60
b    2   30     70
c    3   40     80
d    4   50     90

#在行末追加新数据行
  one two  three
a   1  20   60.0
b   2  30   70.0
c   3  40   80.0
d   4  50   90.0
e   Q   W    NaN
3.2.12 删除DataFrame数据行
可以使用行索引标签,从 DataFrame 中删除某一行数据。如果索引标签存在重复,那么它们将被一起删除
pop(行索引) 删除某一行
pop(列名) 删除某一列
注意:如果有重复的行索引并通过drop()会同时删除
import pandas as pd

data = {'one': [1, 2, 3, 4], 'two': [20, 30, 40, 50], 'three': [60, 70, 80, 90]}
df1 = pd.DataFrame(data,index=['a', 'b', 'c', 'd'])
print(f'原数据\n{df1}')

# pop(行索引)  删除某一行
df = df1.drop('a')
print(f'pop(行索引)  删除某一行\n{df}')

# pop(列名)    删除某一列
df1.pop("one")
print(f'#pop(列名)    删除某一列\n{df1}')
运行结果显示如下:
原数据
   one  two  three
a    1   20     60
b    2   30     70
c    3   40     80
d    4   50     90
pop(行索引)  删除某一行
   one  two  three
b    2   30     70
c    3   40     80
d    4   50     90
#pop(列名)    删除某一列
   two  three
a   20     60
b   30     70
c   40     80
d   50     90
3.2.13 DataFrame属性方法info(),index,coloumns,values ,axes
- info():返回DataFrame对象的相关信息
- index:返回行索引
- coloumns:返回列索引
- values:使用numpy数组表示Dataframe中的元素值
- axes: 返回一个行标签、列标签组成的列表
import pandas as pd

data = {
    'name:': pd.Series(['c语言中文网', "百度", '360搜索', '谷歌', 'Bing搜索', 'CSDN', '华为云']),
    'year': pd.Series([5, 6, 15, 28, 3, 19, 23]),
    'Rating': pd.Series([4.23, 3.24, 3.98, 2.56, 3.20, 4.6, 3.8])}
df = pd.DataFrame(data)
print(f'#原数据\n{df}')

# info() 获取相关信息
print(f'#df.info()获取DataFrame相关信息\n{df.info()}')

# index 获取行索引
print(f'#df.index 获取行索引\n{df.index}')

# coloumns 获取行索引
print(f'#df.columns 获取列索引\n{df.columns}')

# axes 获取行标签、列标签组成的列表
print(f'#df.axes 获取行标签、列标签组成的列表\n{df.axes}')

# values 使用numpy数组表示Dataframe中的元素值
print(f'#df.values获取Dataframe中的元素值\n{df.values}')
运行结果显示如下:
#原数据
    name:  year  Rating
0  c语言中文网     5    4.23
1      百度     6    3.24
2   360搜索    15    3.98
3      谷歌    28    2.56
4  Bing搜索     3    3.20
5    CSDN    19    4.60
6     华为云    23    3.80
<class 'pandas.core.frame.DataFrame'>
RangeIndex: 7 entries, 0 to 6
Data columns (total 3 columns):
 #   Column  Non-Null Count  Dtype
---  ------  --------------  -----
 0   name:   7 non-null      object
 1   year    7 non-null      int64
 2   Rating  7 non-null      float64
dtypes: float64(1), int64(1), object(1)
memory usage: 296.0+ bytes
#df.info()获取DataFrame相关信息
None
#df.index 获取行索引
RangeIndex(start=0, stop=7, step=1)
#df.columns 获取列索引
Index(['name:', 'year', 'Rating'], dtype='object')
#df.axes 获取行标签、列标签组成的列表
[RangeIndex(start=0, stop=7, step=1), Index(['name:', 'year', 'Rating'], dtype='object')]
#df.values获取Dataframe中的元素值
[['c语言中文网' 5 4.23]
 ['百度' 6 3.24]
 ['360搜索' 15 3.98]
 ['谷歌' 28 2.56]
 ['Bing搜索' 3 3.2]
 ['CSDN' 19 4.6]
 ['华为云' 23 3.8]]
3.2.14 head()&tail()查看DataFrame数据
如果想要查看 DataFrame 的一部分数据,可以使用 head() 或者 tail() 方法。其中 head() 返回前 n 行数据,默认显示前 5 行数据
import pandas as pd

data = {
    'name:': pd.Series(['c语言中文网', "百度", '360搜索', '谷歌', 'Bing搜索', 'CSDN', '华为云']),
    'year': pd.Series([5, 6, 15, 28, 3, 19, 23]),
    'Rating': pd.Series([4.23, 3.24, 3.98, 2.56, 3.20, 4.6, 3.8])}

df = pd.DataFrame(data)
print(f'#原数据\n{df}')

# head(n) 返回前n行数据 默认是前5行
print(f'#df.head(n) 返回前n行数据\n{df.head(2)}')

# tail(n) 返回后n行数据
print(f'#df.tail(n) 返回后n行数据\n{df.tail(2)}')
运行结果显示如下:
#原数据
    name:  year  Rating
0  c语言中文网     5    4.23
1      百度     6    3.24
2   360搜索    15    3.98
3      谷歌    28    2.56
4  Bing搜索     3    3.20
5    CSDN    19    4.60
6     华为云    23    3.80

#df.head(n) 返回前n行数据
    name:  year  Rating
0  c语言中文网     5    4.23
1      百度     6    3.24

#df.tail(n) 返回后n行数据
  name:  year  Rating
5  CSDN    19     4.6
6   华为云    23     3.8
3.2.15 dtypes查看DataFrame数据类型
返回每一列数据的类型
import pandas as pd

data = {
    'name:': pd.Series(['c语言中文网', "百度", '360搜索', '谷歌', 'Bing搜索', 'CSDN', '华为云']),
    'year': pd.Series([5, 6, 15, 28, 3, 19, 23]),
    'Rating': pd.Series([4.23, 3.24, 3.98, 2.56, 3.20, 4.6, 3.8])}

df = pd.DataFrame(data)
print(f'#原数据\n{df}')

# dtpes 获取每一列数据的数据类型
print(f'#df.dtpes返回每一列的数据类型\n{df.dtypes}')
运行结果显示如下:
#原数据
    name:  year  Rating
0  c语言中文网     5    4.23
1      百度     6    3.24
2   360搜索    15    3.98
3      谷歌    28    2.56
4  Bing搜索     3    3.20
5    CSDN    19    4.60
6     华为云    23    3.80

#df.dtpes返回每一列的数据类型
name:      object
year        int64
Rating    float64
dtype: object
3.2.16 empty判断DataFrame是否为空
返回一个布尔值,判断输出的数据对象是否为空,若为 True 表示对象为空。
import pandas as pd

data = {
    'name:': pd.Series(['c语言中文网', "百度", '360搜索', '谷歌', 'Bing搜索', 'CSDN', '华为云']),
    'year': pd.Series([5, 6, 15, 28, 3, 19, 23]),
    'Rating': pd.Series([4.23, 3.24, 3.98, 2.56, 3.20, 4.6, 3.8])}

df = pd.DataFrame(data)
print(f'#原数据\n{df}')

# empty 判断输出的数据对象是否为空,若为 True 表示对象为空
print(f'#df.empty 对象是否为空,若为 True 表示对象为空\n{df.empty}')
运行结果显示如下:
#原数据
    name:  year  Rating
0  c语言中文网     5    4.23
1      百度     6    3.24
2   360搜索    15    3.98
3      谷歌    28    2.56
4  Bing搜索     3    3.20
5    CSDN    19    4.60
6     华为云    23    3.80
#df.empty 对象是否为空,若为 True 表示对象为空
False
3.2.17 ndim&shape查看DataFrame维数和维度
ndimf:返回数据对象的维数
shape:返回一个代表 DataFrame 维度的元组。返回值元组 (a,b),其中 a 表示行数,b 表示列数
import pandas as pd

data = {
    'name:': pd.Series(['c语言中文网', "百度", '360搜索', '谷歌', 'Bing搜索', 'CSDN', '华为云']),
    'year': pd.Series([5, 6, 15, 28, 3, 19, 23]),
    'Rating': pd.Series([4.23, 3.24, 3.98, 2.56, 3.20, 4.6, 3.8])}
df = pd.DataFrame(data)
print(f'#原数据\n{df}')

# ndim 查看DataFrame的维数 同时也适合Series
print(f"#df.ndim 查看DataFrame的维数\n{df.ndim}")

# shape 维度的元组。返回值元组 (a,b),其中 a 表示行数,b 表示列数 同时也适合Series
print(f"#df.shape 维度的元组。返回值元组 (a,b),其中 a 表示行数,b 表示列数\n{df.shape}")
运行结果显示如下:
#原数据
    name:  year  Rating
0  c语言中文网     5    4.23
1      百度     6    3.24
2   360搜索    15    3.98
3      谷歌    28    2.56
4  Bing搜索     3    3.20
5    CSDN    19    4.60
6     华为云    23    3.80
#df.ndim 查看DataFrame的维数
2
#df.shape 维度的元组。返回值元组 (a,b),其中 a 表示行数,b 表示列数
(7, 3)
3.2.18 size查看DataFrame的元素数量
返回DataFrame对象的元素数量
import pandas as pd

data = {
    'name:': pd.Series(['c语言中文网', "百度", '360搜索', '谷歌', 'Bing搜索', 'CSDN', '华为云']),
    'year': pd.Series([5, 6, 15, 28, 3, 19, 23]),
    'Rating': pd.Series([4.23, 3.24, 3.98, 2.56, 3.20, 4.6, 3.8])}
df = pd.DataFrame(data)
print(f'#原数据\n{df}')

# size查看DataFrame对象元素的数量
print(f'#df.size 查看DataFrame对象元素的数量\n{df.size}')
运行结果显示如下:
#原数据
    name:  year  Rating
0  c语言中文网     5    4.23
1      百度     6    3.24
2   360搜索    15    3.98
3      谷歌    28    2.56
4  Bing搜索     3    3.20
5    CSDN    19    4.60
6     华为云    23    3.80
#df.size 查看DataFrame对象元素的数量
21
3.2.19 T(Transpose)对DataFrame转置
import pandas as pd

data = {
    'name:': pd.Series(['c语言中文网', "百度", '360搜索', '谷歌', 'Bing搜索', 'CSDN', '华为云']),
    'year': pd.Series([5, 6, 15, 28, 3, 19, 23]),
    'Rating': pd.Series([4.23, 3.24, 3.98, 2.56, 3.20, 4.6, 3.8])}
df = pd.DataFrame(data)
print(f'#原数据\n{df}')

#  T(Transpose)转置  把行和列进行交换
print(f'#df.T把行和列进行交换\n{df.T}')
运行结果显示如下:
#原数据
    name:  year  Rating
0  c语言中文网     5    4.23
1      百度     6    3.24
2   360搜索    15    3.98
3      谷歌    28    2.56
4  Bing搜索     3    3.20
5    CSDN    19    4.60
6     华为云    23    3.80
#df.T把行和列进行交换
             0     1      2     3       4     5    6
name:   c语言中文网    百度  360搜索    谷歌  Bing搜索  CSDN  华为云
year         5     6     15    28       3    19   23
Rating    4.23  3.24   3.98  2.56     3.2   4.6  3.8
3.3 pandas描述性统计
描述统计学(descriptive statistics)是一门统计学领域的学科,主要研究如何取得反映客观现象的数据,并以图表形式对所搜集的数据进行处理和显示,最终对数据的规律、特征做出综合性的描述分析。Pandas 库正是对描述统计学知识完美应用的体现,可以说如果没有“描述统计学”作为理论基奠,那么 Pandas 是否存在犹未可知。下列表格对Pandas常用的统计学函数做了简单的总结:
| 函数名称 | 描述说明 |
|---|---|
| count() | 统计某个非空值的数量。 |
| sum() | 求和 |
| mean() | 求均值 |
| median() | 求中位数 |
| mode() | 求众数 |
| std() | 求标准差 |
| min() | 求最小值 |
| max() | 求最大值 |
| abs() | 求绝对值 |
| prod() | 求所有数值的乘积。 |
| cumsum() | 计算累计和,axis=0,按照行累加;axis=1,按照列累加。 |
| cumprod() | 计算累计积,axis=0,按照行累积;axis=1,按照列累积。 |
| corr() | 计算数列或变量之间的相关系数,取值-1到1,值越大表示关联性越强。 |
在 DataFrame 中,使用聚合类方法时需要指定轴(axis)参数。下面介绍两种传参方式:
- 对行操作,默认使用 axis=0 或者使用 "index";
- 对列操作,默认使用 axis=1 或者使用 "columns"。
从图 上 可以看出,axis=0 表示按垂直方向进行计算,而 axis=1 则表示按水平方向。
如果想要应用自定义的函数,或者把其他库中的函数应用到 Pandas 对象中,有以下三种方法:
- 操作整个 DataFrame 的函数:pipe()
- 操作行或者列的函数:apply()
- 操作单一元素的函数:applymap()
3.3.1 垂直和水平方向的所有值求和
import pandas as pd

data = {
    'name:': pd.Series(['c语言中文网', "百度", '360搜索', '谷歌', 'Bing搜索', 'CSDN', '华为云']),
    'year': pd.Series([5, 6, 15, 28, 3, 19, 23]),
    'Rating': pd.Series([4.23, 3.24, 3.98, 2.56, 3.20, 4.6, 3.8])}
df = pd.DataFrame(data)

print(f'#原数据\n{df}')

# sum() 默认返回axis=0 (垂直方向)的所有值的和
print(f'#df.sum() 默认返回axis=0(垂直方向)的所有值的和\n{df.sum()}')

df2 = pd.DataFrame(data, columns=['year', 'Rating'])
# sum() 当axis=1 (水平方向)的所有值的和
print(f'#df2.sum(axis=1) 默认返回axis=1 (水平方向)的所有值的和\n{df2.sum(axis=1)}')
运行结果显示如下:
#原数据
    name:  year  Rating
0  c语言中文网     5    4.23
1      百度     6    3.24
2   360搜索    15    3.98
3      谷歌    28    2.56
4  Bing搜索     3    3.20
5    CSDN    19    4.60
6     华为云    23    3.80

#df.sum() 默认返回axis=0(垂直方向)的所有值的和
name:     c语言中文网百度360搜索谷歌Bing搜索CSDN华为云
year                                99
Rating                           25.61
dtype: object

#df2.sum(axis=1) 默认返回axis=1 (水平方向)的所有值的和
0     9.23
1     9.24
2    18.98
3    30.56
4     6.20
5    23.60
6    26.80
dtype: float64
注意:sum() 和 cumsum() 函数可以同时处理数字和字符串数据。虽然字符聚合通常不被使用,但使用这两个函数并不会抛出异常;而对于 abs()、cumprod() 函数则会抛出异常,因为它们无法操作字符串数据。
3.3.2 mean()求均值
import pandas as pd

data = {
    'year': pd.Series([5, 6, 15, 28, 3, 19, 23]),
    'Rating': pd.Series([4.23, 3.24, 3.98, 2.56, 3.20, 4.6, 3.8])}
df = pd.DataFrame(data)

print(f'#原数据\n{df}')
# mean() 求平均值
print(f'#mean() 平均值\n{df.mean()}')
运行结果显示如下:
#原数据
   year  Rating
0     5    4.23
1     6    3.24
2    15    3.98
3    28    2.56
4     3    3.20
5    19    4.60
6    23    3.80
#mean() 平均值
year      14.142857
Rating     3.658571
dtype: float64
3.3.3 std()求标准差
返回数值列的标准差,标准差是方差的算术平方根,它能反映一个数据集的离散程度。注意,平均数相同的两组数据,标准差未必相同。
import pandas as pd

data = {
    'year': pd.Series([5, 6, 15, 28, 3, 19, 23]),
    'Rating': pd.Series([4.23, 3.24, 3.98, 2.56, 3.20, 4.6, 3.8])}
df = pd.DataFrame(data)
print(f'#原数据\n{df}')

print(f'#df.std()求标准差\n{df.std()}')
运行结果显示如下:
#原数据
   year  Rating
0     5    4.23
1     6    3.24
2    15    3.98
3    28    2.56
4     3    3.20
5    19    4.60
6    23    3.80
#df.std()求标准差
year      9.737018
Rating    0.698628
dtype: float64
3.3.4 自定义函数:操作整个数据表 pipe()
通过给 pipe() 函数传递一个自定义函数和适当数量的参数值,从而操作 DataFrme 中的所有元素。下面示例,实现了数据表中的元素值依次加 3
pip()传入函数对应的第一个位置上的参数必须是目标Series或DataFrame,其他相关的参数使用常规的键值对方式传入即可
import pandas as pd
import numpy as np

# 自定义函数
def adder(ele1, ele2):
    return ele1+ele2

# 操作DataFrame
df = pd.DataFrame(np.random.randn(4, 3), columns=['c1', 'c2', 'c3'])
# 相加前
print(f'#原数据\n{df}')
# 相加后
print(f'#df.pipe()相加后的数据\n{df.pipe(adder,3)}')
运行结果显示如下:
#原数据
         c1        c2        c3
0 -0.374634  0.290875  0.021671
1  0.757403  0.218652  0.160206
2 -0.177390 -0.891544 -1.550597
3 -0.118167 -0.921873  0.890214
#df.pipe()相加后的数据
         c1        c2        c3
0  2.625366  3.290875  3.021671
1  3.757403  3.218652  3.160206
2  2.822610  2.108456  1.449403
3  2.881833  2.078127  3.890214
3.3.5 自定义函数:操作行或者列apply()
如果要操作 DataFrame 的某一行或者某一列,可以使用 apply() 方法,该方法与描述性统计方法类似,都有可选参数 axis。
import pandas as pd
import numpy as np

# 自定义函数
def adder(df, data):
    data_list =[]
    columns = df.index.values
    for i in columns:
        value = df[i]
        data_list.append(value+data)
    return np.sum(data_list, axis=0)

df = pd.DataFrame(np.random.randn(5, 3), columns=['col1', 'col2', 'col3'])
print(f'#原始数据\n{df}')
# axis=0默认按列操作,计算每一列均值
print(f'#df.apply(函数)计算每一列均值\n{df.apply(np.mean)}')

df = pd.DataFrame(np.random.randn(5,3),columns=['col1', 'col2', 'col3'])
print(f'#原始数据\n{df}')

# axis=1操作行,对指定行执行自定义函数
df['col4'] = df.apply(adder, args=(3,), axis=1)
print(f'#调用自定义函数\n{df}')
运行结果显示如下:
#原始数据
       col1      col2      col3
0  1.407879 -1.057357 -0.847865
1  0.389119 -1.620390 -1.269465
2 -0.740838 -0.699992  0.429402
3 -1.431036  1.091103 -0.757014
4  1.264738 -0.162598  0.253011
#df.apply(函数)计算每一列均值
col1    0.177973
col2   -0.489847
col3   -0.438386
dtype: float64
#原始数据
       col1      col2      col3
0  1.056548 -0.064314  1.306463
1  0.485457 -0.067215 -1.634539
2  0.120638 -1.214249  0.135860
3 -1.293730  0.477338 -0.925762
4  0.053357 -1.766716  0.050723
#调用自定义函数
       col1      col2      col3       col4
0  1.056548 -0.064314  1.306463  11.298697
1  0.485457 -0.067215 -1.634539   7.783704
2  0.120638 -1.214249  0.135860   8.042250
3 -1.293730  0.477338 -0.925762   7.257846
4  0.053357 -1.766716  0.050723   7.337365
3.3.5 自定义函数:操作单一元素applymap()
DataFrame的 applymap() 函数可以对DataFrame里的每个值进行处理,然后返回一个新的DataFrame
import pandas as pd

df = pd.DataFrame({
    'a': [1, 2, 3],
    'b': [10, 20, 30],
    'c': [5, 10, 15]
})
print(f'#原始数据\n{df}')

def add_one(x, data):
    print(f'x的值 = {x}')
    print(f'data的值={data}')
    return x + 1

df1 = df.applymap(add_one, data=3)
print(f'#applymap()对每个元素操作后\n{df1}')
运行结果显示如下:
#原始数据
   a   b   c
0  1  10   5
1  2  20  10
2  3  30  15
x的值 = 1
data的值=3
x的值 = 2
data的值=3
x的值 = 3
data的值=3
x的值 = 10
data的值=3
x的值 = 20
data的值=3
x的值 = 30
data的值=3
x的值 = 5
data的值=3
x的值 = 10
data的值=3
x的值 = 15
data的值=3
#applymap()对每个元素操作后
   a   b   c
0  2  11   6
1  3  21  11
2  4  31  16
3.4 pandas iteration遍历
如果想要遍历 DataFrame 的每一行,我们下列函数:
- iterrows():以 (row_index,row) 的形式遍历行;
- itertuples():使用已命名元组的方式遍历行。
3.4.1 以 (row_index,row) 的形式遍历行iterrows():
该方法按行遍历,返回一个迭代器,以行索引标签为键,以每一行数据为值。
import pandas as pd
import numpy as np

df = pd.DataFrame(np.random.randn(4, 3), columns=['col1', 'col2', 'col3'])
print(f'#原始数据\n{df}')

# iteritems():以键值对 (key,value) 的形式遍历 以列标签为键,以对应列的元素为值
for key, row in df.iterrows():
    print(f'#key以列标签为键:{key}')
    print(f'#row以对应列的元素为值\n{row}')
运行结果显示如下:
#原始数据
       col1      col2      col3
0 -0.968361 -0.980524  0.645811
1 -1.742061 -0.034852  1.625160
2 -0.152453 -0.186645  0.330469
3  0.837739  0.687838 -0.991223
#key以列标签为键:0
#row以对应列的元素为值
col1   -0.968361
col2   -0.980524
col3    0.645811
Name: 0, dtype: float64
#key以列标签为键:1
#row以对应列的元素为值
col1   -1.742061
col2   -0.034852
col3    1.625160
Name: 1, dtype: float64
#key以列标签为键:2
#row以对应列的元素为值
col1   -0.152453
col2   -0.186645
col3    0.330469
Name: 2, dtype: float64
#key以列标签为键:3
#row以对应列的元素为值
col1    0.837739
col2    0.687838
col3   -0.991223
Name: 3, dtype: float64
3.4.2 使用已命名元组的方式遍历行itertuples()
import pandas as pd
import numpy as np

df = pd.DataFrame(np.random.randn(4, 3), columns=['col1', 'col2', 'col3'])
print(f'#原始数据\n{df}')

for row in df.itertuples():
    print(f'#每一行生成一个元组\n{row}')
运行结果显示如下:
#原始数据
       col1      col2      col3
0 -1.050943  1.098056 -0.858725
1 -0.348473  0.604341  0.249866
2  0.709212 -0.807796 -1.241162
3 -2.333712 -0.830910 -0.952756

#每一行生成一个元组
Pandas(Index=0, col1=-1.0509429373784085, col2=1.098055755892262, col3=-0.8587250615671127)
#每一行生成一个元组
Pandas(Index=1, col1=-0.34847318195598975, col2=0.604340877173634, col3=0.24986633604748865)
#每一行生成一个元组
Pandas(Index=2, col1=0.7092120669600998, col2=-0.8077962199969602, col3=-1.241162396630433)
#每一行生成一个元组
Pandas(Index=3, col1=-2.3337119180323316, col2=-0.8309096657807309, col3=-0.9527559438251861)
3.5 pandas sorting排序
默认根据行标签对所有行排序,或根据列标签对所有列排序,或根据指定某列或某几列对行排序。
函数原型:
sort_index(axis=0, level=None, ascending=True,
           inplace=False, kind='quicksort',
           na_position='last', sort_remaining=True, by=None)
参数说明:
axis:     0按照行名排序;1按照列名排序
level:     默认None,否则按照给定的level顺序排列---貌似并不是,文档
ascending: 默认True升序排列;False降序排列
inplace:   默认False,否则排序之后的数据直接替换原来的数据框
kind:      排序方法,{‘quicksort’, ‘mergesort’, ‘heapsort’}, default ‘quicksort’。似乎不用太关心。
na_position:缺失值默认排在最后{"first","last"}
by:         按照某一列或几列数据进行排序,但是by参数貌似不建议使用
3.5.1 axis=0, ascending=True 默认按“行标签”升序排列
import pandas as pd

df = pd.DataFrame({'b': [1, 2, 2, 3], 'a': [4, 3, 2, 1], 'c': [1, 3, 8, 2]}, index=[2, 0, 1, 3])
print(f'#原始数据\n{df}')

print(f'#默认按“行标签”升序排序,或df.sort_index(axis=0, ascending=True)\n{df.sort_index()}')
运行结果显示如下:
#原始数据
   b  a  c
2  1  4  1
0  2  3  3
1  2  2  8
3  3  1  2
#默认按“行标签”升序排序,或df.sort_index(axis=0, ascending=True)
   b  a  c
0  2  3  3
1  2  2  8
2  1  4  1
3  3  1  2
3.5.2 axis=1 按“列标签”升序排列
import pandas as pd

df = pd.DataFrame({'b': [1, 2, 2, 3], 'a': [4, 3, 2, 1], 'c': [1, 3, 8, 2]}, index=[2, 0, 1, 3])
print(f'#原始数据\n{df}')

print(f'#按“列标签”升序排序,或df.sort_index(axis=1, ascending=True)\n{df.sort_index(axis=1)}')
运行结果显示如下:
#原始数据
   b  a  c
2  1  4  1
0  2  3  3
1  2  2  8
3  3  1  2
#按“列标签”升序排序,或df.sort_index(axis=1, ascending=True)
   a  b  c
2  4  1  1
0  3  2  3
1  2  2  8
3  1  3  2
3.6 pandas去重函数
函数原型:
df.drop_duplicates(subset=['A','B','C'],keep='first',inplace=True)参数说明:
 subset:表示要进去重的列名,默认为 None。
 keep:有三个可选参数,分别是 first、last、False,默认为 first,表示只保留第一次出现的重复项,删除其余重复项,last 表示只保留最后一次出现的重复项,False 则表示删除所有重复项。
 inplace:布尔值参数,默认为 False 表示删除重复项后返回一个副本,若为 Ture 则表示直接在原数据上删除重复项。
3.6.1 保留第一次出现的行重复项
import pandas as pd
data = {
    'A': [1, 0, 1, 1],
    'B': [0, 2, 5, 0],
    'C': [4, 0, 4, 4],
    'D': [1, 0, 1, 1]
}
df = pd.DataFrame(data)
print(f'#原始数据\n{df}')

# 默认是keep=first 保留第一次出现的重复项  inplace=False 删除后返回一个副本
df_drop = df.drop_duplicates()
print(f'#去重后的数据\n{df_drop}')

# 也可以使用以下参数
df_drop = df.drop_duplicates(keep='first', inplace=False)
print(f'#去重后的数据2\n{df_drop}')
运行结果显示如下:
#原始数据
   A  B  C  D
0  1  0  4  1
1  0  2  0  0
2  1  5  4  1
3  1  0  4  1
#去重后的数据
   A  B  C  D
0  1  0  4  1
1  0  2  0  0
2  1  5  4  1
#去重后的数据2
   A  B  C  D
0  1  0  4  1
1  0  2  0  0
2  1  5  4  1
3.6.2 keep=False删除所有行重复项
import pandas as pd

data = {
    'A': [1, 0, 1, 1],
    'B': [0, 2, 5, 0],
    'C': [4, 0, 4, 4],
    'D': [1, 0, 1, 1]
}
df = pd.DataFrame(data)
print(f'#原始数据\n{df}')

# keep=False 删除所有重复项(行)  inplace=True 在原始的数据进行删除重复项(行)
df.drop_duplicates(keep=False, inplace=True)
print(f'#去重后的数据\n{df}')
运行结果显示如下:
#原始数据
   A  B  C  D
0  1  0  4  1
1  0  2  0  0
2  1  5  4  1
3  1  0  4  1
#去重后的数据
   A  B  C  D
1  0  2  0  0
2  1  5  4  1
3.6.3 subset删除指定的单列去重
import pandas as pd

data = {
    'A': [1, 0, 1, 1],
    'B': [0, 2, 5, 0],
    'C': [4, 0, 4, 4],
    'D': [1, 0, 1, 1]
}
df = pd.DataFrame(data)
print(f'#原始数据\n{df}')

# subset:表示要进去重的列名,默认为 None。
# 去除所有重复项,对于B列来说两个0是重复项
df_drop = df.drop_duplicates(subset=['B'], inplace=False, keep=False)

# 简写,省去subset参数
# df.drop_duplicates(['B'],keep=False)

print(f'#删除指定的列\n{df_drop}')

# reset_index() 函数会直接使用重置后的索引,索引从0开始
df_reset = df_drop.reset_index(drop=True)

print(f'重新设置行索引后的数据\n{df_reset}')
运行结果显示如下:
#原始数据
   A  B  C  D
0  1  0  4  1
1  0  2  0  0
2  1  5  4  1
3  1  0  4  1
#删除指定的列
   A  B  C  D
1  0  2  0  0
2  1  5  4  1
重新设置行索引后的数据
   A  B  C  D
0  0  2  0  0
1  1  5  4  1
删除重复项后,行标签使用的数字是原来的,并没有从 0 重新开始,Pandas 提供的 reset_index() 函数会直接使用重置后的索引。
3.6.4 subset指定多列同时去重
import pandas as pd

df = pd.DataFrame({'C_ID': [1, 1, 2, 12, 34, 23, 45, 34, 23, 12, 2, 3, 4, 1],
                    'Age': [12, 12, 15, 18, 12, 25, 21, 25, 25, 18, 25,12,32,18],
                   'G_ID': ['a', 'a', 'c', 'a', 'b', 's', 'd', 'a', 'b', 's', 'a', 'd', 'a', 'a']})

print(f'#原始数据\n{df}')

# last只保留最后一个重复项  去除重复项后并不更改行索引
df_drop = df.drop_duplicates(['Age', 'G_ID'], keep='last')
print(f'#去除指定多列的数据\n{df_drop}')
运行结果显示如下:
#原始数据
    C_ID  Age G_ID
0      1   12    a
1      1   12    a
2      2   15    c
3     12   18    a
4     34   12    b
5     23   25    s
6     45   21    d
7     34   25    a
8     23   25    b
9     12   18    s
10     2   25    a
11     3   12    d
12     4   32    a
13     1   18    a
#去除指定多列的数据
    C_ID  Age G_ID
1      1   12    a
2      2   15    c
4     34   12    b
5     23   25    s
6     45   21    d
8     23   25    b
9     12   18    s
10     2   25    a
11     3   12    d
12     4   32    a
13     1   18    a
3.7 Pandas缺失值处理
3.7.1 检查缺失值
为了使检测缺失值变得更容易,Pandas 提供了 isnull() 和 notnull() 两个函数,它们同时适用于 Series 和 DataFrame对象
isnull() 判断是缺失值 若是则返回True ,反之返回False
import pandas as pd
import numpy as np

df = pd.DataFrame(np.random.randn(3, 3), index=list("ace"), columns=['one', 'two', 'three'])
print(f'原始数据\n{df}')

# 通过使用reindex(重构索引),创建了一个存在缺少值的 DataFrame对象
df = df.reindex(['a', 'b', 'c', 'd', 'e', 'f'])
print(f'#使用 reindex(重构索引)后的数据\n{df}')

# isnull() 检查是否是缺失值,若是则返回True 反之返回False
print(f'#isnull()判断第one列的每个元素是否是缺失值\n{df["one"].isnull()}')
运行结果显示如下:
原始数据
        one       two     three
a -0.946582  0.054540  0.586515
c  1.756336  0.082180  0.174922
e -2.136985  0.247677 -1.501012
#使用 reindex(重构索引)后的数据
        one       two     three
a -0.946582  0.054540  0.586515
b       NaN       NaN       NaN
c  1.756336  0.082180  0.174922
d       NaN       NaN       NaN
e -2.136985  0.247677 -1.501012
f       NaN       NaN       NaN
#isnull()判断第one列的每个元素是否是缺失值
a    False
b     True
c    False
d     True
e    False
f     True
Name: one, dtype: bool
notnull()判断不是缺失值 若不是缺失值则返回True,反之返回False
import pandas as pd
import numpy as np

df = pd.DataFrame(np.random.randn(3, 3), index=list("ace"), columns=['one', 'two', 'three'])
print(f'原始数据\n{df}')

# 通过使用 reindex(重构索引),创建了一个存在缺少值的 DataFrame对象
df = df.reindex(['a', 'b', 'c', 'd', 'e', 'f'])
print(f'#使用 reindex(重构索引)后的数据\n{df}')

# notnull() 检查是否不是缺失值,若不是则返回True 反之返回False
print(f'判断是第one列的每个元素是否不是缺失值\n{df["one"].notnull()}')
运行结果显示如下:
原始数据
        one       two     three
a -0.998457  1.810817  0.348848
c  1.831015  0.319635  0.903095
e -0.572937  1.237014 -0.093289
#使用 reindex(重构索引)后的数据
        one       two     three
a -0.998457  1.810817  0.348848
b       NaN       NaN       NaN
c  1.831015  0.319635  0.903095
d       NaN       NaN       NaN
e -0.572937  1.237014 -0.093289
f       NaN       NaN       NaN
判断是第one列的每个元素是否不是缺失值
a     True
b    False
c     True
d    False
e     True
f    False
Name: one, dtype: bool
3.7.2 缺失数据计算
计算缺失数据时,需要注意两点:首先数据求和时,将 NA 值视为 0 ,其次,如果要计算的数据为 NA,那么结果就是 NA
import pandas as pd
import numpy as np

df = pd.DataFrame(np.random.randn(3, 3), index=list("ace"), columns=['one', 'two', 'three'])
print(f'#原始数据\n{df}')

# 通过使用 reindex(重构索引),创建了一个存在缺少值的 DataFrame对象
df = df.reindex(['a', 'b', 'c', 'd', 'e', 'f'])
print(f'#使用 reindex(重构索引)后的数据\n{df}')

# 计算缺失数据时,需要注意两点:首先数据求和时,将 NA 值视为 0 ,其次,如果要计算的数据为 NA,那么结果就是 NA
print(df['one'].sum())
运行结果显示如下:
#原始数据
        one       two     three
a  0.274570 -0.007715 -0.138648
c  0.428160 -0.878011  0.165583
e -0.338313  0.643098 -0.715703
#使用 reindex(重构索引)后的数据
        one       two     three
a  0.274570 -0.007715 -0.138648
b       NaN       NaN       NaN
c  0.428160 -0.878011  0.165583
d       NaN       NaN       NaN
e -0.338313  0.643098 -0.715703
f       NaN       NaN       NaN
0.3644171755923789
3.7.3 清理并填充缺失值
fillna()标量替换NaN
import pandas as pd
import numpy as np

df = pd.DataFrame(np.random.randn(3, 3), index=list("ace"), columns=['one', 'two', 'three'])
print(f'#原始数据\n{df}')

# 通过使用 reindex(重构索引),创建了一个存在缺少值的 DataFrame对象
df = df.reindex(['a', 'b', 'c', 'd', 'e', 'f'])
print(f'#使用 reindex(重构索引)后的数据\n{df}')

# 用fillna(6)标量替换NaN
print(f'用fillna(6)标量替换NaN后的数据\n{df.fillna(6)}')
运行结果显示如下:
#原始数据
        one       two     three
a  0.577051  1.152249  0.614189
c -1.957000  1.306602 -0.463318
e  0.103491  0.280445 -2.530827

#使用 reindex(重构索引)后的数据
        one       two     three
a  0.577051  1.152249  0.614189
b       NaN       NaN       NaN
c -1.957000  1.306602 -0.463318
d       NaN       NaN       NaN
e  0.103491  0.280445 -2.530827
f       NaN       NaN       NaN

用fillna(6)标量替换NaN后的数据
        one       two     three
a  0.577051  1.152249  0.614189
b  6.000000  6.000000  6.000000
c -1.957000  1.306602 -0.463318
d  6.000000  6.000000  6.000000
e  0.103491  0.280445 -2.530827
f  6.000000  6.000000  6.000000
ffill() 向前填充和 bfill() 向后填充,填充NA
import pandas as pd
import numpy as np

df = pd.DataFrame(np.random.randn(3, 3), index=list("ace"), columns=['one', 'two', 'three'])
print(f'#原始数据\n{df}')

# 通过使用 reindex(重构索引),创建了一个存在缺少值的 DataFrame对象
df = df.reindex(['a', 'b', 'c', 'd', 'e', 'f'])
print(f'#使用 reindex(重构索引)后的数据\n{df}')
print(f"#.fillna(method='ffill')向前填充后的数据\n{df.fillna(method='ffill')}")
print(f"#.bfillna()向后填充后的数据\n{df.bfill()}")
运行结果显示如下:
#原始数据
        one       two     three
a -0.480378  0.730596 -1.192572
c  0.651002  1.834280  1.179207
e  0.146290 -0.618078  2.782963
#使用 reindex(重构索引)后的数据
        one       two     three
a -0.480378  0.730596 -1.192572
b       NaN       NaN       NaN
c  0.651002  1.834280  1.179207
d       NaN       NaN       NaN
e  0.146290 -0.618078  2.782963
f       NaN       NaN       NaN
#.fillna(method='ffill')向前填充后的数据
        one       two     three
a -0.480378  0.730596 -1.192572
b -0.480378  0.730596 -1.192572
c  0.651002  1.834280  1.179207
d  0.651002  1.834280  1.179207
e  0.146290 -0.618078  2.782963
f  0.146290 -0.618078  2.782963
#.bfillna()向后填充后的数据
        one       two     three
a -0.480378  0.730596 -1.192572
b  0.651002  1.834280  1.179207
c  0.651002  1.834280  1.179207
d  0.146290 -0.618078  2.782963
e  0.146290 -0.618078  2.782963
f       NaN       NaN       NaN
3.7.4 使用replace替换通用值
在某些情况下,您需要使用 replace() 将 DataFrame 中的通用值替换成特定值,这和使用 fillna() 函数替换 NaN 值是类似的
import pandas as pd

df = pd.DataFrame({'one': [10, 20, 30, 40, 50, 10], 'two': [99, 0, 30, 40, 50, 60]})
print(f'#原始数据\n{df}')

df = df.replace({10: 100, 30: 333, 99: 9})
print(f'#replace替换后的数据\n{df}')
运行结果显示如下:
#原始数据
   one  two
0   10   99
1   20    0
2   30   30
3   40   40
4   50   50
5   10   60
#replace替换后的数据
   one  two
0  100    9
1   20    0
2  333  333
3   40   40
4   50   50
5  100   60
3.7.5 删除缺失值
如果想删除缺失值,那么使用 dropna() 函数与参数 axis 可以实现。在默认情况下,按照 axis=0 来按行处理,这意味着如果某一行中存在 NaN 值将会删除整行数据
import pandas as pd
import numpy as np

df = pd.DataFrame(np.random.randn(3, 3), index=list("ace"), columns=['one', 'two', 'three'])
print(f'#原始数据\n{df}')

# 通过使用 reindex(重构索引),创建了一个存在缺少值的 DataFrame对象
df = df.reindex(['a', 'b', 'c', 'd', 'e', 'f'])
print(f'#使用 reindex(重构索引)后的数据\n{df}')

# dropna() axis=0如果某一行中存在 NaN 值将会删除整行数据
print(f'#dropna()删除后的数据\n{df.dropna()}')
运行结果显示如下:
#原始数据
        one       two     three
a -0.822900  0.025019  0.934275
c  0.215935 -0.634852 -1.236928
e -0.044390  0.464661  0.367780
#使用 reindex(重构索引)后的数据
        one       two     three
a -0.822900  0.025019  0.934275
b       NaN       NaN       NaN
c  0.215935 -0.634852 -1.236928
d       NaN       NaN       NaN
e -0.044390  0.464661  0.367780
f       NaN       NaN       NaN
#dropna()删除后的数据
        one       two     three
a -0.822900  0.025019  0.934275
c  0.215935 -0.634852 -1.236928
e -0.044390  0.464661  0.367780
3.8 pandas csv操作
使用pandas做数据处理的第一步就是读取数据,数据源可以来自于各种地方,csv文件便是其中之一。而读取csv文件,pandas也提供了非常强力的支持,参数有四五十个。这些参数中,有的很容易被忽略,但是在实际工作中却用处很大 。
3.8.1 read_csv()读取文件
函数原型:
pandas.read_csv(filepath_or_buffer, sep=',', delimiter=None,
                header='infer',names=None, index_col=None,
                usecols=None)
index_col()自定义索引:在 CSV 文件中指定了一个列,然后使用index_col可以实现自定义索引
文件内容如下(test.csv):
ID,Name,Age,City,Salary
1,Jack,28,Beijing,22000
2,Lida,32,Shanghai,19000
3,John,43,Shenzhen,12000
4,Helen,38,Hengshui,3500
import pandas as pd
# 读取csv文件数据 sep :指定分隔符。如果不指定参数,则会尝试使用逗号分隔
df = pd.read_csv('test.csv', sep=',')
print(f'#读取csv文件数据\n{df}')
# 使用index_col可以实现自定义索引
df = pd.read_csv('test.csv', index_col=['ID'])
print(f'使用index_col可以实现自定义索引\n{df}')
print(f'获取自定义的索引={df.index}')运行结果显示如下:
#读取csv文件数据
   ID   Name  Age      City  Salary
0   1   Jack   28   Beijing   22000
1   2   Lida   32  Shanghai   19000
2   3   John   43  Shenzhen   12000
3   4  Helen   38  Hengshui    3500
使用index_col可以实现自定义索引
     Name  Age      City  Salary
ID
1    Jack   28   Beijing   22000
2    Lida   32  Shanghai   19000
3    John   43  Shenzhen   12000
4   Helen   38  Hengshui    3500
获取自定义的索引=Index([1, 2, 3, 4], dtype='int64', name='ID')
3.8.2 names更改文件标头名
使用 names 参数可以指定头文件的名称
- 当names没被赋值时,header会变成0,即选取数据文件的第一行作为列名。
- 当 names 被赋值,header 没被赋值时,那么header会变成None。如果都赋值,就会实现两个参数的组合功能。
import pandas as pd

df = pd.read_csv('test.csv', sep=',')
print(f'#读取csv文件数据\n{df}')

# names更改文件标头名 header 没有赋值
df = pd.read_csv('test.csv', names=['a', 'b', 'c', 'd', 'e'])
print(f'#names 更改表头名\n{df}')
运行结果显示如下:
#读取csv文件数据
   ID   Name  Age      City  Salary
0   1   Jack   28   Beijing   22000
1   2   Lida   32  Shanghai   19000
2   3   John   43  Shenzhen   12000
3   4  Helen   38  Hengshui    3500
#names 更改表头名
    a      b    c         d       e
0  ID   Name  Age      City  Salary
1   1   Jack   28   Beijing   22000
2   2   Lida   32  Shanghai   19000
3   3   John   43  Shenzhen   12000
4 4 Helen 38 Hengshui 3500注意:文件标头名是附加的自定义名称,原来的标头名(列标签名)并没有被删除,此时可以使用header参数来删除它
import pandas as pd

# names更改文件标头名 header为变成0,即选取文件的第一行作为表头
df = pd.read_csv("test.csv", names=['a', 'b', 'c', 'd', 'e'],header=0)
print(f'#names 更改表头名且header=0\n{df}')

df = pd.read_csv('test.csv',header=1)
# 不指定names,指定header为1,则选取第二行当做表头,第二行下面的是数据

print(f'#不指定names,指定header=1则选取第二行当做表头\n{df}')
运行结果显示如下:
#names 更改表头名且header=0
   a      b   c         d      e
0  1   Jack  28   Beijing  22000
1  2   Lida  32  Shanghai  19000
2  3   John  43  Shenzhen  12000
3  4  Helen  38  Hengshui   3500
#不指定names,指定header=1则选取第二行当做表头
   1   Jack  28   Beijing  22000
0  2   Lida  32  Shanghai  19000
1  3   John  43  Shenzhen  12000
2  4  Helen  38  Hengshui   3500
3.8.3 skiprows跳过指定的行数
skiprows参数表示跳过指定的行数
import pandas as pd

df = pd.read_csv('test.csv', names=['a', 'b', 'c', 'd', 'e'], header=0)
print(f'#names 更改表头名且header=0\n{df}')

# skiprows指定跳过行数
df = pd.read_csv('test.csv', skiprows=2)
print(f'#skiprows指定跳过行数\n{df}')
运行结果显示如下:
#names 更改表头名且header=0
   a      b   c         d      e
0  1   Jack  28   Beijing  22000
1  2   Lida  32  Shanghai  19000
2  3   John  43  Shenzhen  12000
3  4  Helen  38  Hengshui   3500
#skiprows指定跳过行数
   2   Lida  32  Shanghai  19000
0  3   John  43  Shenzhen  12000
1  4  Helen  38  Hengshui   3500
3.8.4 to_csv()转换数据
Pandas 提供的 to_csv() 函数用于将 DataFrame 转换为 CSV 数据。如果想要把 CSV 数据写入文件,只需向函数传递一个文件对象即可。否则,CSV 数据将以字符串格式返回。
import pandas as pd

data = {'Name': ['Smith', 'Parker'], 'ID': [101, 102], 'Language': ['Python', 'JavaScript']}
df_data = pd.DataFrame(data)
print(f'#DataFrame原始数据\n{df_data}')

# 通过to_csv()转成csv文件数据
df_csv = df_data.to_csv()
print(f'#通过to_csv()转成csv文件数据后的数据\n{df_csv}')

# 指定 CSV 文件输出时的分隔符,并将其保存在 pandas.csv 文件中index=False 表示不写入索引
df_data.to_csv("person.csv", sep='|', index=False)
运行结果显示如下:
#DataFrame原始数据
     Name   ID    Language
0   Smith  101      Python
1  Parker  102  JavaScript
#通过to_csv()转成csv文件数据后的数据
,Name,ID,Language
0,Smith,101,Python
1,Parker,102,JavaScript
存储的person.csv文件:
Name|ID|Language
Smith|101|Python
Parker|102|JavaScript
3.9 pandas操作Excel
3.9.1 to_excel()数据转换
通过 to_excel() 函数可以将 Dataframe 中的数据写入到 Excel 文件。
如果想要把单个对象写入 Excel 文件,那么必须指定目标文件名;如果想要写入到多张工作表中,则需要创建一个带有目标文件名的ExcelWriter对象,并通过sheet_name参数依次指定工作表的名称。
函数原型:
DataFrame.to_excel(excel_writer, sheet_name='Sheet1',
                   na_rep='', float_format=None,
                   columns=None, header=True,
                   index=True, index_label=None,
                   startrow=0, startcol=0, engine=None,
                   merge_cells=True, encoding=None,
                   inf_rep='inf', verbose=True, freeze_panes=None)
常用参数说明:
| 参数名称 | 描述说明 |
|---|---|
| excel_wirter | 文件路径或者 ExcelWrite 对象。 |
| sheet_name | 指定要写入数据的工作表名称。 |
| na_rep | 缺失值的表示形式。 |
| float_format | 它是一个可选参数,用于格式化浮点数字符串。 |
| columns | 指要写入的列。 |
| header | 写出每一列的名称,如果给出的是字符串列表,则表示列的别名。 |
| index | 表示要写入的索引。 |
| index_label | 引用索引列的列标签。如果未指定,并且 hearder 和 index 均为为 True,则使用索引名称。如果 DataFrame 使用 MultiIndex,则需要给出一个序列。 |
| startrow | 初始写入的行位置,默认值0。表示引用左上角的行单元格来储存 DataFrame。 |
| startcol | 初始写入的列位置,默认值0。表示引用左上角的列单元格来储存 DataFrame。 |
| engine | 它是一个可选参数,用于指定要使用的引擎,可以是 openpyxl 或 xlsxwriter。 |
创建表格并写入数据
import pandas as pd

# 创建DataFrame数据
info_website = pd.DataFrame({'name': ['博客中国', 'c语言中文网', 'CSDN', '92python'],
     'rank': [1, 2, 3, 4],
     'language': ['PHP', 'C', 'PHP', 'Python']})
print(f'#DataFrame数据\n{info_website}')

# 创建ExcelWrite对象
to_excle_file_path = 'test_excel.xlsx'
writer = pd.ExcelWriter(to_excle_file_path)
info_website.to_excel(writer)
writer.close()
运行结果显示如下:
#DataFrame数据
       name  rank language
0      博客中国     1      PHP
1    c语言中文网     2        C
2      CSDN     3      PHP
3  92python     4   Python
test_excel.xlsx内容如下:
| name | rank | language | |
| 0 | 博客中国 | 1 | PHP |
| 1 | c语言中文网 | 2 | C |
| 2 | CSDN | 3 | PHP |
| 3 | 92python | 4 | Python |
使用pd.ExcelWriter生成writer,然后就可将数据写入该excel文件了,但是写完之后必须要writer.close(),否则数据仍然只在数据流中,并没保存到excel文件中。
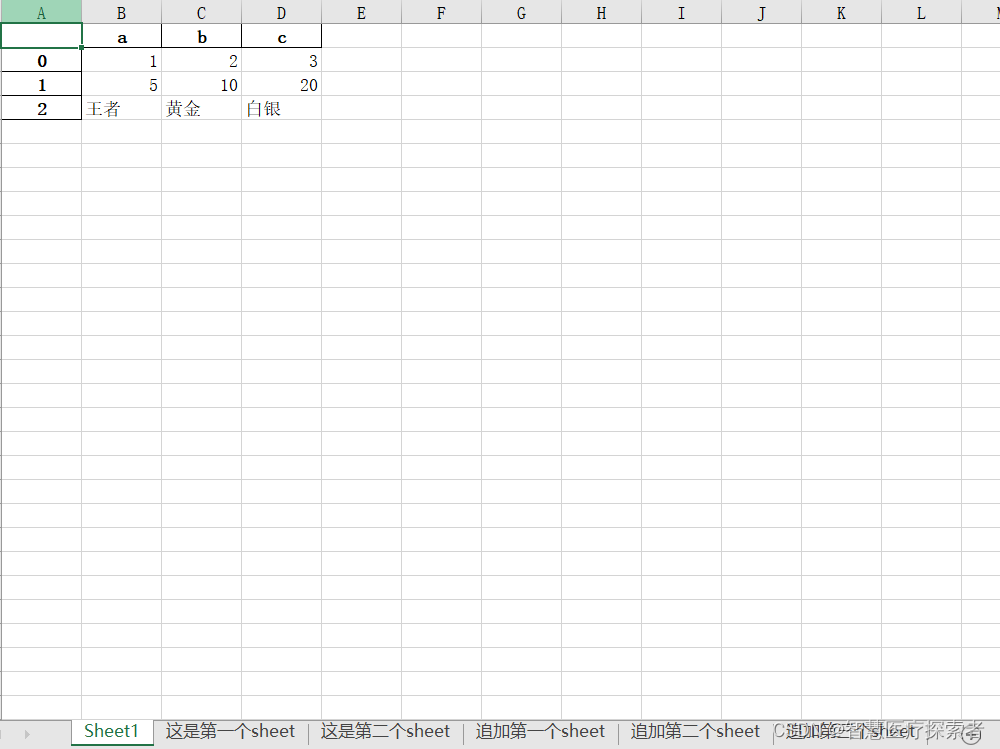
3.9.2 一次性插入多个sheet数据
注意:此操作会将原文件内容覆盖掉
import pandas as pd
to_excle_file_path = 'test_excel2.xlsx'
# 创建DataFrame数据 字典嵌套数组类型
info_website = pd.DataFrame({'name': ['博客中国', 'c语言中文网', 'CSDN', '92python'],
'rank': [1, 2, 3, 4],
'language': ['PHP', 'C', 'PHP', 'Python']})
print(f'#DataFrame数据\n{info_website}')
# 数组嵌套字典类型
data = [{'a': 1, 'b': 2, 'c': 3},
{'a': 5, 'b': 10, 'c': 20},
{'a': "王者", 'b': '黄金', 'c': '白银'}]
df = pd.DataFrame(data)
print(f'#DataFrame数据\n{df}')
writer = pd.ExcelWriter(to_excle_file_path)
df.to_excel(writer)
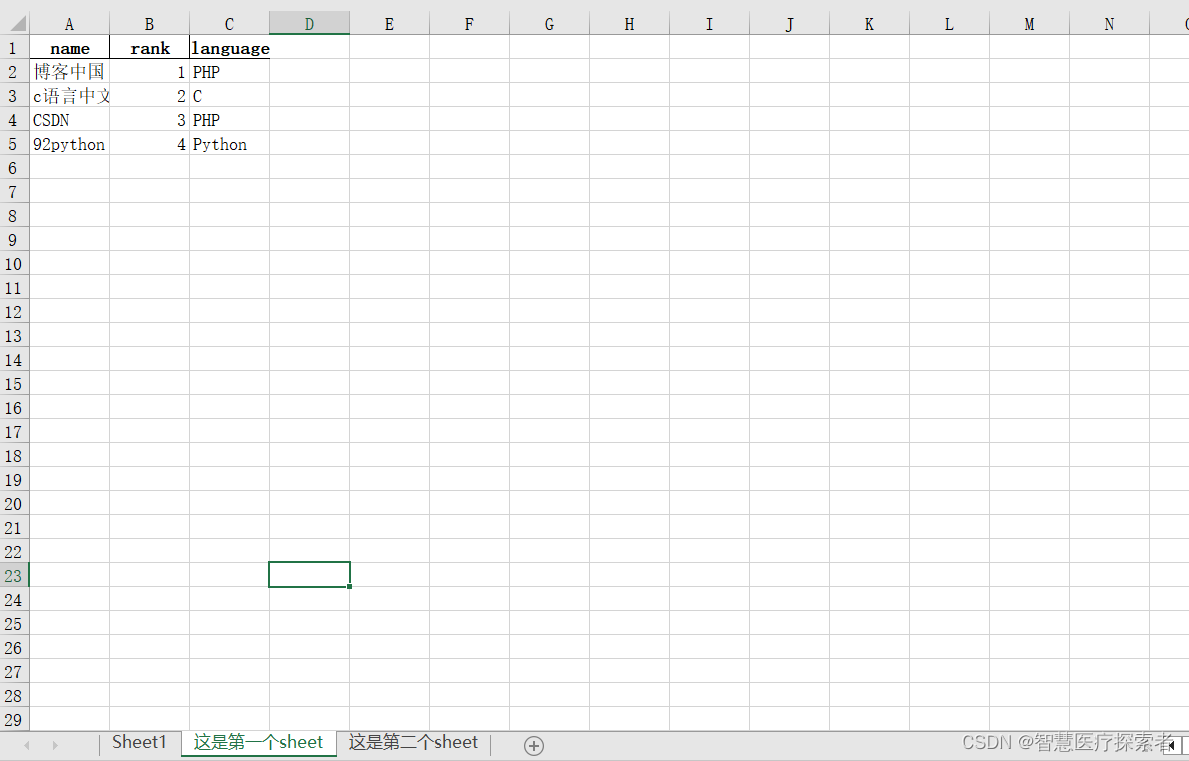
info_website.to_excel(writer, sheet_name="这是第一个sheet", index=False)
info_website.to_excel(writer, sheet_name="这是第二个sheet", index=False)
writer.close()运行结果显示如下:
#DataFrame数据
       name  rank language
0      博客中国     1      PHP
1    c语言中文网     2        C
2      CSDN     3      PHP
3  92python     4   Python
#DataFrame数据
    a   b   c
0   1   2   3
1   5  10  20
2  王者  黄金  白银
保存的文件内容如下:
3.9.3 追加sheet表内容
import pandas as pd

to_excle_file_path = 'test_excel2.xlsx'

# 创建DataFrame数据 字典嵌套数组类型
info_website = pd.DataFrame({'name': ['博客中国', 'c语言中文网', 'CSDN', '92python'],
     'rank': [1, 2, 3, 4],
     'language': ['PHP', 'C', 'PHP', 'Python']})
print(f'#DataFrame数据\n{info_website}')

# 数组嵌套字典类型
data = [{'a': 1, 'b': 2, 'c': 3},
        {'a': 5, 'b': 10, 'c': 20},
        {'a': "王者", 'b': '黄金', 'c': '白银'}]
df = pd.DataFrame(data)
print(f'#DataFrame数据\n{df}')

writer = pd.ExcelWriter(to_excle_file_path, mode='a', engine='openpyxl')
df.to_excel(writer, sheet_name="追加第一个sheet", index=False)

info_website.to_excel(writer, sheet_name="追加第二个sheet", index=False)
info_website.to_excel(writer, sheet_name="追加第三个sheet", index=False)
writer.close()
运行结果显示如下:
#DataFrame数据
       name  rank language
0      博客中国     1      PHP
1    c语言中文网     2        C
2      CSDN     3      PHP
3  92python     4   Python
#DataFrame数据
    a   b   c
0   1   2   3
1   5  10  20
2  王者  黄金  白银
Excel内容写入后如下:
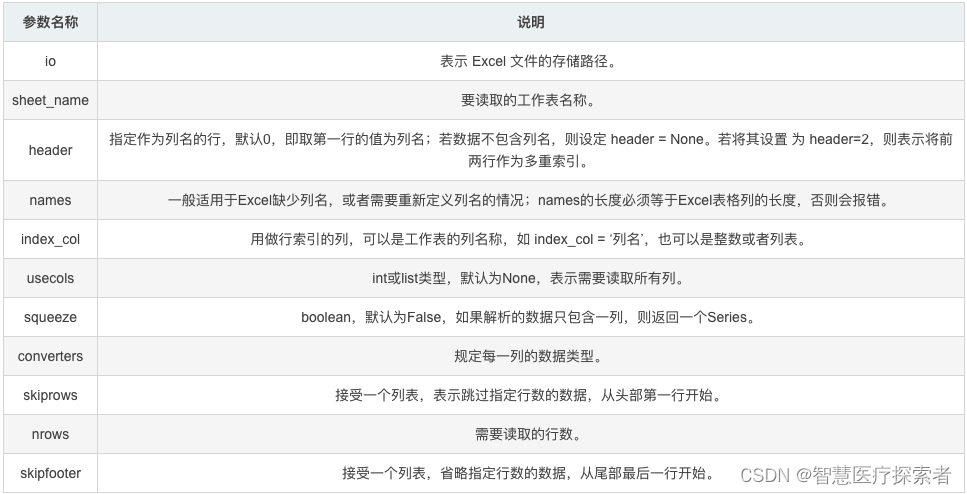
3.9.4 read_excel()读取数据
可以使用 read_excel() 方法读取 Excel 表格中的数据,其语法格式如下:
pandas.read_excel(io, sheet_name=0, header=0, names=None, index_col=None,
              usecols=None, squeeze=False,dtype=None, engine=None,
              converters=None, true_values=None, false_values=None,
              skiprows=None, nrows=None, na_values=None, parse_dates=False,
              date_parser=None, thousands=None, comment=None, skipfooter=0,
              convert_float=True, **kwds)
常用参数如下:
处理未命名的列以及重新定义索引
import pandas as pd

#读取excel数据
file_path = 'test_excel.xlsx'

df = pd.read_excel(file_path, engine='openpyxl')
print(f'#原始数据\n{df}')

# 选择name列做为索引,并跳过前两行
df = pd.read_excel(file_path, index_col='name', skiprows=[2], engine='openpyxl')
print(f'#选择name列做为索引,并跳过前两行\n{df}')

# 处理未命名列
df.columns = df.columns.str.replace('Unnamed.*', 'col_label')
print(f'#修改为未命名的列\n{df}')
运行结果显示如下:
#原始数据
   Unnamed: 0      name  rank language
0           0      博客中国     1      PHP
1           1    c语言中文网     2        C
2           2      CSDN     3      PHP
3           3  92python     4   Python
#选择name列做为索引,并跳过前两行
          Unnamed: 0  rank language
name
博客中国               0     1      PHP
CSDN               2     3      PHP
92python           3     4   Python
#修改为未命名的列
          Unnamed: 0  rank language
name
博客中国               0     1      PHP
CSDN               2     3      PHP
92python           3     4   Python
index_col前多列作为索引列,usecols设置读取的数据列
import pandas as pd

# 读取excel数据
file_path = 'test_excel.xlsx'

df = pd.read_excel(file_path, engine='openpyxl')
print(f'#原始数据\n{df}')

# index_col选择前两列作为索引列 选择前三列数据,name列作为行索引
df = pd.read_excel(file_path, index_col=[0, 1], usecols=[0, 1, 2],engine='openpyxl')
print(f'#ndex_col选择前两列作为索引列 选择前三列数据,name列作为行索引\n{df}')
运行结果显示如下:
#原始数据
   Unnamed: 0      name  rank language
0           0      博客中国     1      PHP
1           1    c语言中文网     2        C
2           2      CSDN     3      PHP
3           3  92python     4   Python
#ndex_col选择前两列作为索引列 选择前三列数据,name列作为行索引

  name         rank
0 博客中国         1
1 c语言中文网       2
2 CSDN         3
3 92python     4
3.10 pandas支持的文件格式
Pandas几乎支持市面上所有的主流数据存储形式,如Excel和CSV到JSON及各种数据库。
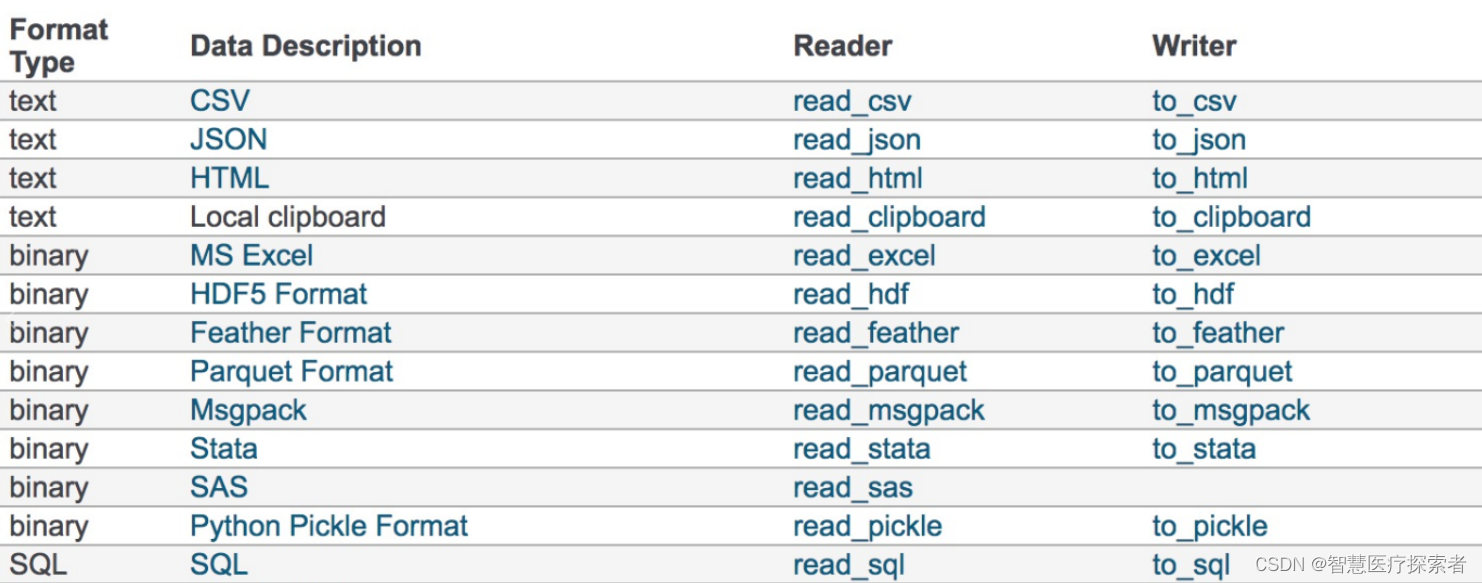
Pandas 提供了许多函数来加载数据,主要有以下几个函数:
read_csv():从 CSV 文件加载数据read_excel():从 Excel 文件加载数据read_sql():从 SQL 数据库加载数据read_json():从 JSON 文件加载数据read_html():从 HTML 文件加载数据
Pandas 提供了多种函数来将数据保存到不同的文件格式中,主要有以下几个函数:
to_csv():将数据保存到 CSV 文件中to_excel():将数据保存到 Excel 文件中to_sql():将数据保存到 SQL 数据库中to_json():将数据保存到 JSON 文件中to_html():将数据保存到 HTML 文件中

瓜分20万奖金 获得内推名额 丰厚实物奖励 易参与易上手
更多推荐


 1
1 0
0- 0


 已为社区贡献8条内容

所有评论(0)