
hystrix监控配置
一、dashboard:Hystrix还提供了近乎实时的监控,包括执行了每秒执行了多少请求,多少成功,多少失败等等,更多指标请查看:https://github.com/Netflix/Hystrix/wiki/Metrics-and-Monitoring要想使用dashboard,需要在pom.xml中额外引入:hystrix-metrics-event-strea...
·
一、dashboard:
Hystrix还提供了近乎实时的监控,包括执行了每秒执行了多少请求,多少成功,多少失败等等,更多指标请查看:https://github.com/Netflix/Hystrix/wiki/Metrics-and-Monitoring
要想使用dashboard,需要在pom.xml中额外引入:hystrix-metrics-event-stream,这样就可以通过配置一个servlet把这些监控的metrics实时push出来,然后再在dashboard中展示。
<dependency>
<groupId>com.netflix.hystrix</groupId>
<artifactId>hystrix-core</artifactId>
<version>1.5.9</version>
</dependency>
<dependency>
<groupId>com.netflix.hystrix</groupId>
<artifactId>hystrix-metrics-event-stream</artifactId>
<version>1.1.2</version>
</dependency>
1、配置servlet:
<servlet>
<description></description>
<display-name>
HystrixMetricsStreamServlet
</display-name>
<servlet-name>
HystrixMetricsStreamServlet
</servlet-name>
<servlet-class>
com.netflix.hystrix.contrib.metrics.eventstream.HystrixMetricsStreamServlet
</servlet-class>
</servlet>
<servlet-mapping>
<servlet-name>
HystrixMetricsStreamServlet
</servlet-name>
<url-pattern>
/hystrix.stream
</url-pattern>
</servlet-mapping>
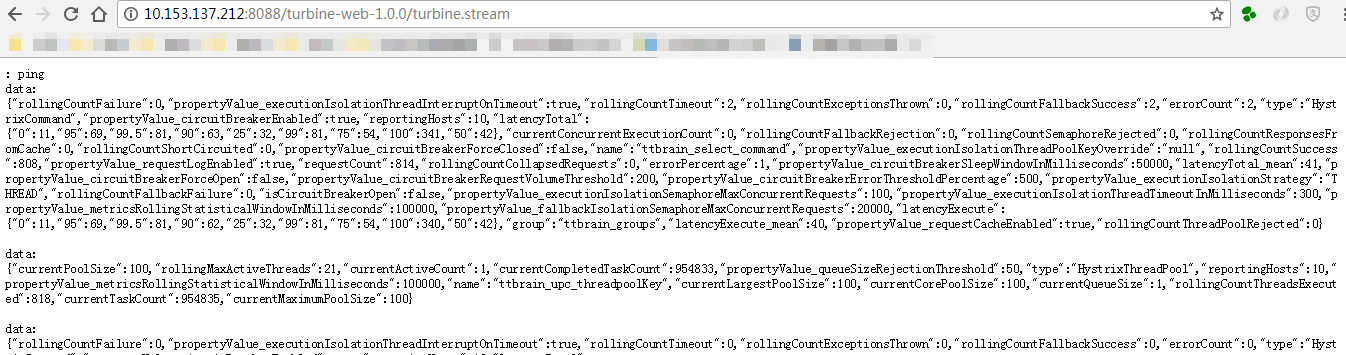
1)重新启动系统,
http://hostname:port/appname/hystrix.stream
就可以实时访问这些监控metrics了,如下图:
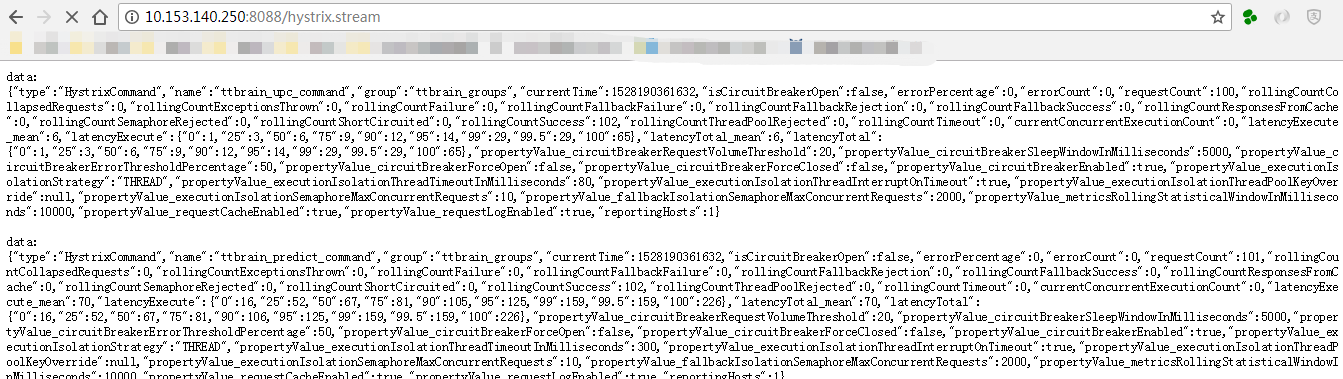
2)可能会遇到“HTTP Status 503 - MaxConcurrentConnections reached: 5”这种错误,原因是版本不兼容,解决方法是将hystrix-metrics-event-stream 降成1.1.2即可。
2、配置dashboard:
上面的监控信息是纯文本的,可读性差,Netflix又开发了一个开源项目(Dashboard:https://github.com/Netflix/Hystrix/wiki/Dashboard)
1)下载dashboard,在
http://search.maven.org/
中搜索,然后下载war包

2)配置:
将war包放到tomcat即可,然后在页面上配置好需要监控服务的hystrix.stream 连接
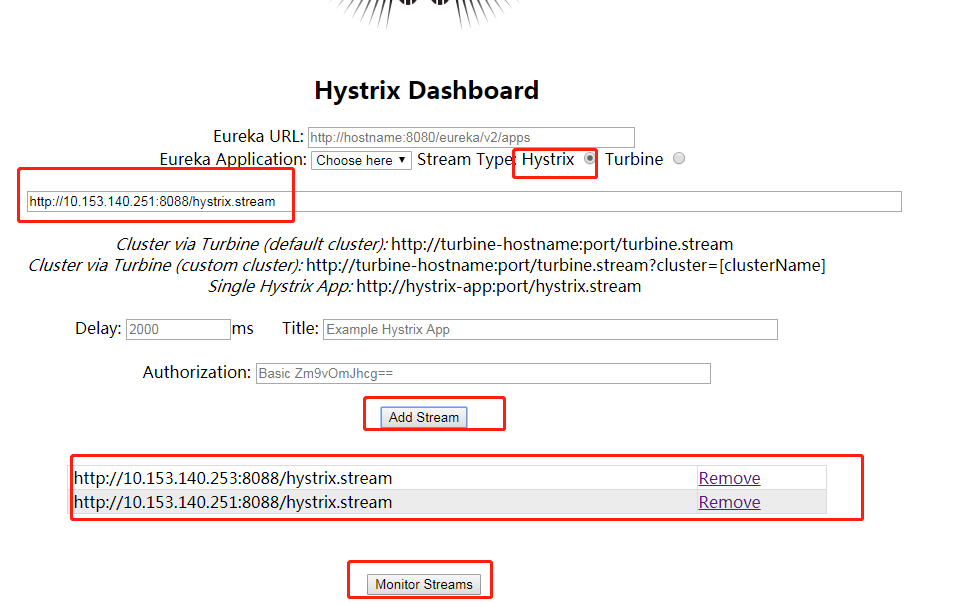
最后点击Monitor Streams现实监控图表:

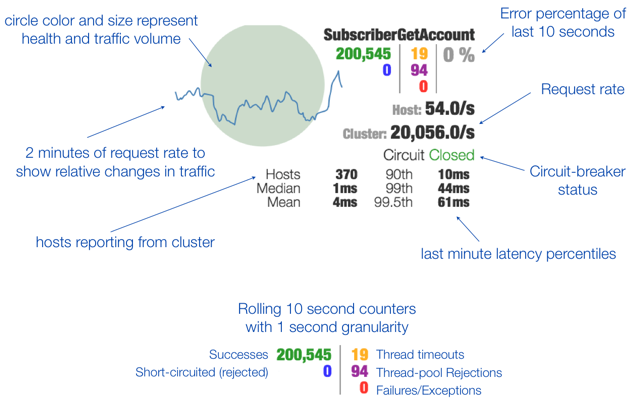
3)说明:
Dashboard主要展示了两类信息:一是HystrixCommand的执行情况,Hystrix Wiki上详细说明了图上的每个指标代表的含义:
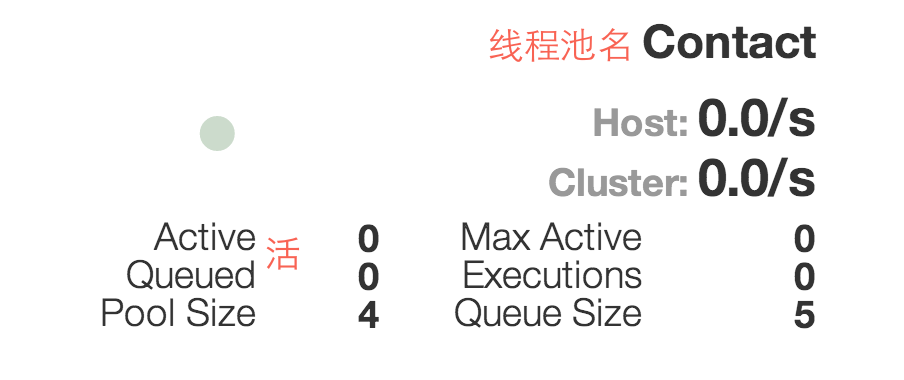
二是线程池的状态,包括线程池名,大小,当前活跃线程说,最大活跃线程数,排队队列大小等
二、Turbine
在复杂的分布式系统中,相同服务的结点经常需要部署上百甚至上千个,很多时候,运维人员希望能够把相同服务的节点状态以一个整体集群的形式展现出来,这样可以更好的把握整个系统的状态。 为此,Netflix又提供了一个开源项目(Turbine,
https://github.com/Netflix/Turbine/wiki/Getting-Started-(1.x))来提供把多个hystrix.stream的内容聚合为一个数据源供Dashboard展示。Turbine会聚集同一个微服务的相同的commandKey、Threadpool、commandGroupKey数据进行聚合。
原理:通过trubine配置文件,将每个服务的hystrix.stream数据收集到trubine,然后进行汇总,最后再通过dashboard展示。
Turbine有2种用法,其一是内嵌Turbine到你的项目中;另外一个是把Turbine当做一个独立的Module。不管哪种用法,配置文件都是一致的。 Turbine默认会在classpath下查找配置文件:config.properties。
1、安装:
1)下载Turbine.war(https://github.com/downloads/Netflix/Turbine/turbine-web-1.0.0.war),并把其置于Web容器中即可;
2)此时,访问turbine连接会得到如下信息:

2、配置:
1)集群:
turbine.aggregator.clusterConfig=myserviceA-dev,myserviceA-prod,myserviceB-dev,myserviceB-prod
- turbine会对同一个集群下的相同的commandKey、Threadpool、commandGroupKey数据进行聚合。
- 通常,我们会将相同环境的相同微服务化为一个集群(如上),当然也可以设置成myserviceA-dev1,myserviceA-dev2这样的分别进行统计。
2)
host连接配置(turbine连接hystrix-dashboard的url)
全局:
turbine.instanceUrlSuffix=:7080/hystrix.stream
单个指定:
turbine.instanceUrlSuffix.myserviceA-dev=:8001/hystrix.stream
turbine.instanceUrlSuffix.myserviceA-prod=:8001/hystrix.stream
turbine.instanceUrlSuffix.myserviceB-dev=:8001/hystrix.stream
turbine.instanceUrlSuffix.myserviceB-prod=:8001/hystrix.stream
注:
turbine的host链接指定的优先级:单个指定>全局,只有在某个集群没有单个指定的时候,才使用全局指定
3)server配置(InstanceDiscovery,用于指定某个集群下有哪些server要连接)
turbine.ConfigPropertyBasedDiscovery.myserviceA-dev.instances = 11.0.11.11,22.0.22.22
以上三者的关系:1指定常量(用在2和3中),2和3拼装成访问的url,如上,myserviceA-dev的turbine访问路径就是把11.0.11.11:8001/hystrix.stream和22.0.22.22:8001/hystrix.steam的metrics统计在一起,然后在turbineIP:turbinePORT/turbine/turbine.stream?
cluster=myserviceA-dev
下进行展示。
注意:turbine的访问路径下必须有cluster名字的指定,除非在配置文件中cluster使用default,如下:

此时,通过访问浏览器turbine连接,会得到如下数据:
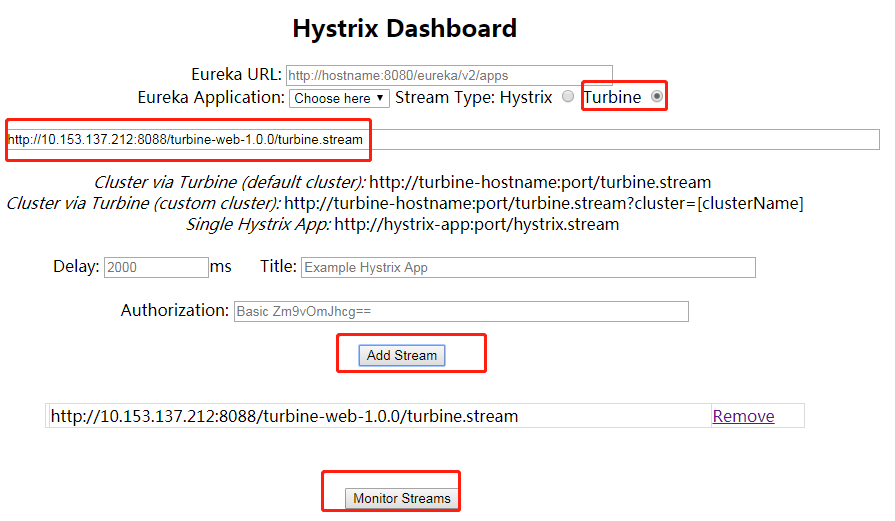
3、配置到dashboard:
1)先打开dashboard界面:
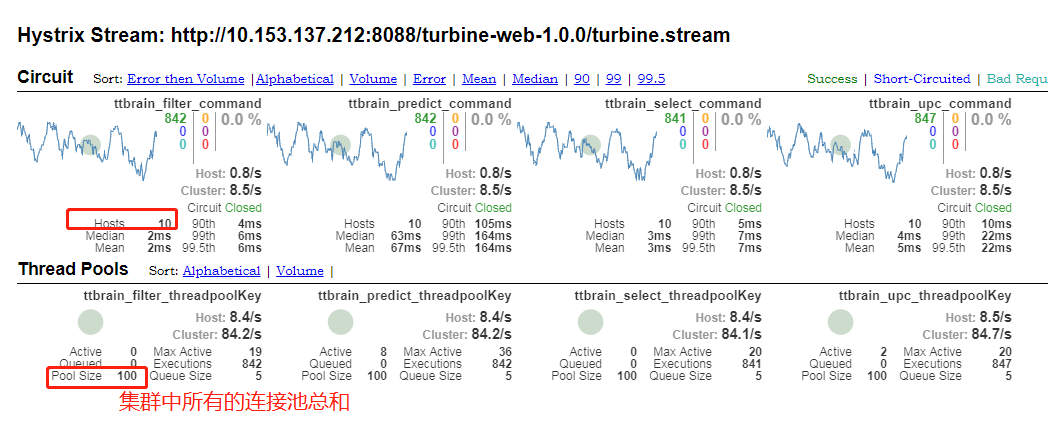
2)查看,我们可以看到host已经是集群上所有的服务器了,同时连接池等也是急群众所有服务的连接池总和...

瓜分20万奖金 获得内推名额 丰厚实物奖励 易参与易上手
更多推荐

 0
0 0
0- 0


 已为社区贡献13条内容

所有评论(0)